Immigrants from Bulgaria vs Hispanic or Latino Ambulatory Disability
COMPARE
Immigrants from Bulgaria
Hispanic or Latino
Ambulatory Disability
Ambulatory Disability Comparison
Immigrants from Bulgaria
Hispanics or Latinos
5.6%
AMBULATORY DISABILITY
99.8/ 100
METRIC RATING
55th/ 347
METRIC RANK
6.4%
AMBULATORY DISABILITY
2.2/ 100
METRIC RATING
235th/ 347
METRIC RANK
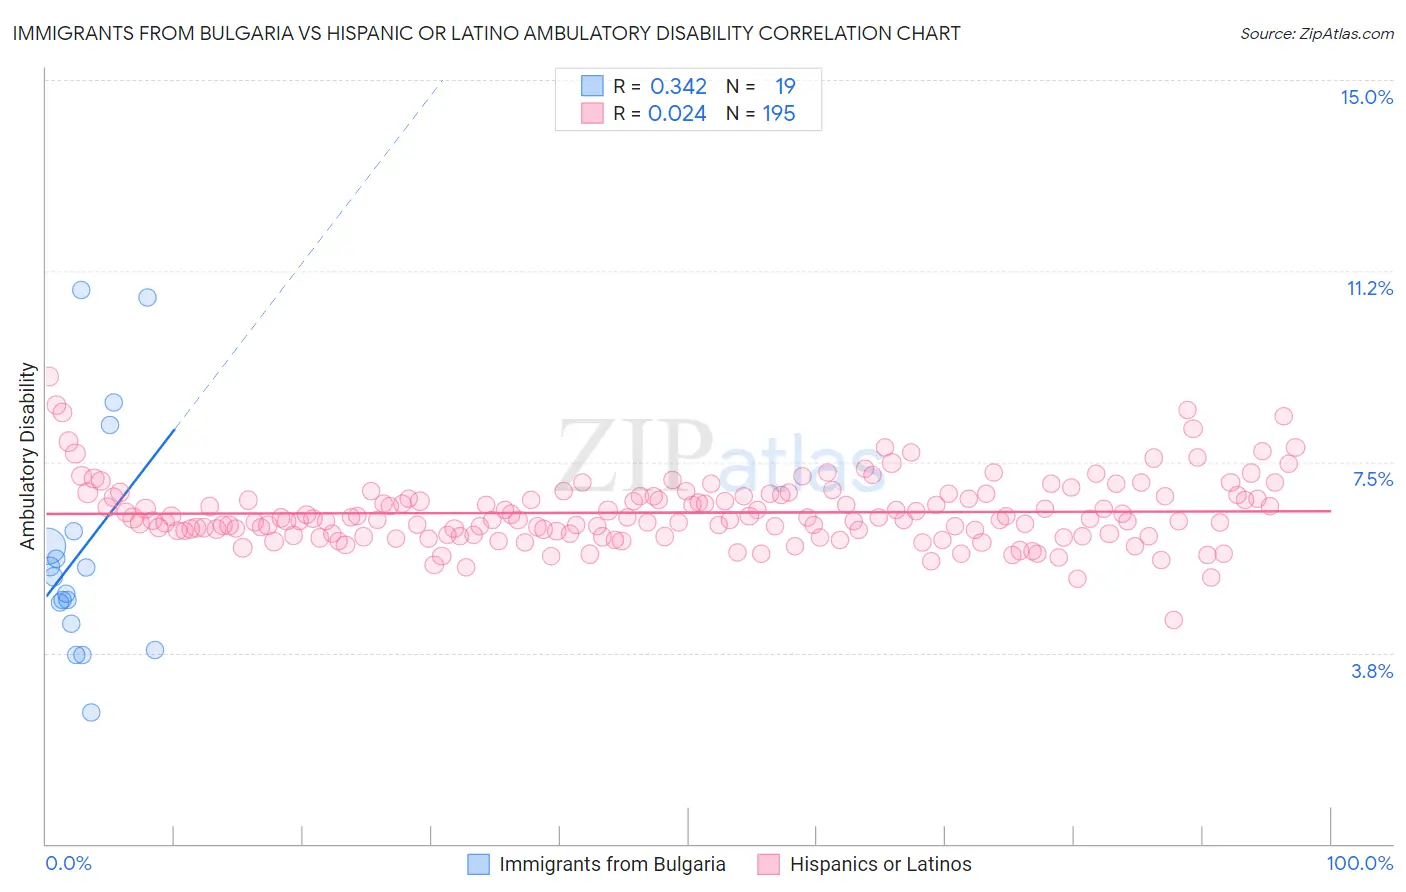
Immigrants from Bulgaria vs Hispanic or Latino Ambulatory Disability Correlation Chart
The statistical analysis conducted on geographies consisting of 172,546,961 people shows a mild positive correlation between the proportion of Immigrants from Bulgaria and percentage of population with ambulatory disability in the United States with a correlation coefficient (R) of 0.342 and weighted average of 5.6%. Similarly, the statistical analysis conducted on geographies consisting of 572,469,194 people shows no correlation between the proportion of Hispanics or Latinos and percentage of population with ambulatory disability in the United States with a correlation coefficient (R) of 0.024 and weighted average of 6.4%, a difference of 14.6%.
Ambulatory Disability Correlation Summary
| Measurement | Immigrants from Bulgaria | Hispanic or Latino |
| Minimum | 2.6% | 4.4% |
| Maximum | 10.9% | 9.2% |
| Range | 8.3% | 4.8% |
| Mean | 5.8% | 6.5% |
| Median | 5.2% | 6.4% |
| Interquartile 25% (IQ1) | 4.3% | 6.1% |
| Interquartile 75% (IQ3) | 6.1% | 6.8% |
| Interquartile Range (IQR) | 1.8% | 0.75% |
| Standard Deviation (Sample) | 2.3% | 0.65% |
| Standard Deviation (Population) | 2.2% | 0.65% |
Similar Demographics by Ambulatory Disability
Demographics Similar to Immigrants from Bulgaria by Ambulatory Disability
In terms of ambulatory disability, the demographic groups most similar to Immigrants from Bulgaria are Immigrants from Eastern Africa (5.6%, a difference of 0.070%), Inupiat (5.6%, a difference of 0.090%), Immigrants from Egypt (5.6%, a difference of 0.11%), Jordanian (5.6%, a difference of 0.12%), and Taiwanese (5.6%, a difference of 0.21%).
| Demographics | Rating | Rank | Ambulatory Disability |
| Immigrants | Argentina | 99.9 /100 | #48 | Exceptional 5.6% |
| Bulgarians | 99.9 /100 | #49 | Exceptional 5.6% |
| Luxembourgers | 99.9 /100 | #50 | Exceptional 5.6% |
| Taiwanese | 99.8 /100 | #51 | Exceptional 5.6% |
| Jordanians | 99.8 /100 | #52 | Exceptional 5.6% |
| Immigrants | Egypt | 99.8 /100 | #53 | Exceptional 5.6% |
| Immigrants | Eastern Africa | 99.8 /100 | #54 | Exceptional 5.6% |
| Immigrants | Bulgaria | 99.8 /100 | #55 | Exceptional 5.6% |
| Inupiat | 99.8 /100 | #56 | Exceptional 5.6% |
| Immigrants | Brazil | 99.8 /100 | #57 | Exceptional 5.6% |
| Immigrants | Zimbabwe | 99.8 /100 | #58 | Exceptional 5.6% |
| Immigrants | Afghanistan | 99.8 /100 | #59 | Exceptional 5.6% |
| Immigrants | Lithuania | 99.8 /100 | #60 | Exceptional 5.6% |
| Immigrants | Belgium | 99.7 /100 | #61 | Exceptional 5.6% |
| Immigrants | Spain | 99.7 /100 | #62 | Exceptional 5.6% |
Demographics Similar to Hispanics or Latinos by Ambulatory Disability
In terms of ambulatory disability, the demographic groups most similar to Hispanics or Latinos are Immigrants from Liberia (6.4%, a difference of 0.030%), Subsaharan African (6.4%, a difference of 0.060%), Assyrian/Chaldean/Syriac (6.4%, a difference of 0.12%), Dutch (6.4%, a difference of 0.15%), and Immigrants from Germany (6.4%, a difference of 0.24%).
| Demographics | Rating | Rank | Ambulatory Disability |
| Portuguese | 4.0 /100 | #228 | Tragic 6.4% |
| Czechoslovakians | 3.8 /100 | #229 | Tragic 6.4% |
| Mexicans | 3.5 /100 | #230 | Tragic 6.4% |
| Panamanians | 3.1 /100 | #231 | Tragic 6.4% |
| Assyrians/Chaldeans/Syriacs | 2.4 /100 | #232 | Tragic 6.4% |
| Sub-Saharan Africans | 2.3 /100 | #233 | Tragic 6.4% |
| Immigrants | Liberia | 2.3 /100 | #234 | Tragic 6.4% |
| Hispanics or Latinos | 2.2 /100 | #235 | Tragic 6.4% |
| Dutch | 2.0 /100 | #236 | Tragic 6.4% |
| Immigrants | Germany | 1.8 /100 | #237 | Tragic 6.4% |
| Haitians | 1.8 /100 | #238 | Tragic 6.4% |
| Senegalese | 1.7 /100 | #239 | Tragic 6.4% |
| Immigrants | Senegal | 1.7 /100 | #240 | Tragic 6.4% |
| Immigrants | Haiti | 1.6 /100 | #241 | Tragic 6.5% |
| Spaniards | 1.6 /100 | #242 | Tragic 6.5% |