Immigrants from Bulgaria vs Sierra Leonean Ambulatory Disability
COMPARE
Immigrants from Bulgaria
Sierra Leonean
Ambulatory Disability
Ambulatory Disability Comparison
Immigrants from Bulgaria
Sierra Leoneans
5.6%
AMBULATORY DISABILITY
99.8/ 100
METRIC RATING
55th/ 347
METRIC RANK
5.7%
AMBULATORY DISABILITY
99.4/ 100
METRIC RATING
70th/ 347
METRIC RANK
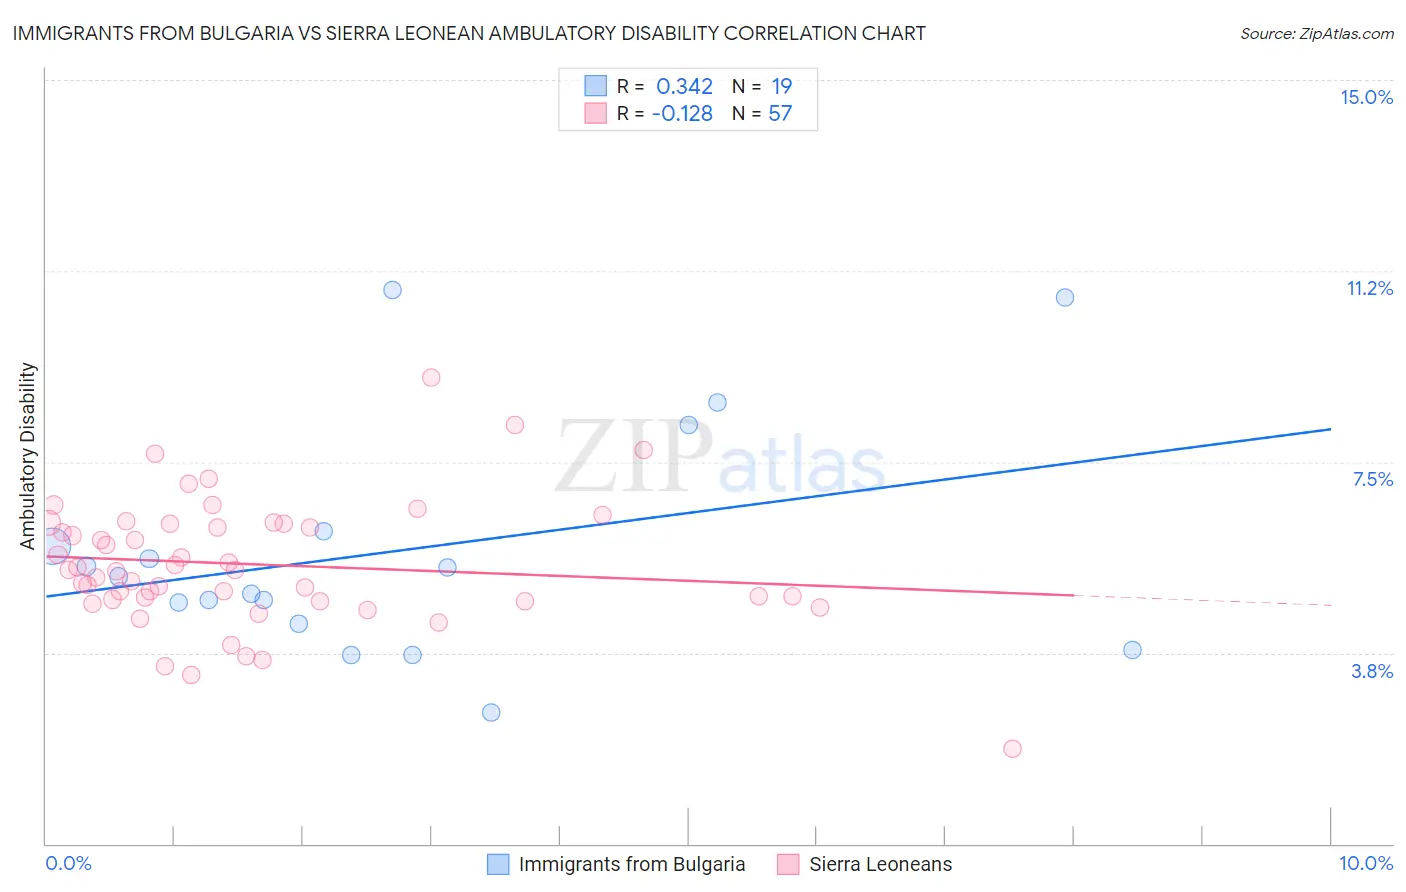
Immigrants from Bulgaria vs Sierra Leonean Ambulatory Disability Correlation Chart
The statistical analysis conducted on geographies consisting of 172,546,961 people shows a mild positive correlation between the proportion of Immigrants from Bulgaria and percentage of population with ambulatory disability in the United States with a correlation coefficient (R) of 0.342 and weighted average of 5.6%. Similarly, the statistical analysis conducted on geographies consisting of 83,336,135 people shows a poor negative correlation between the proportion of Sierra Leoneans and percentage of population with ambulatory disability in the United States with a correlation coefficient (R) of -0.128 and weighted average of 5.7%, a difference of 1.7%.
Ambulatory Disability Correlation Summary
| Measurement | Immigrants from Bulgaria | Sierra Leonean |
| Minimum | 2.6% | 1.9% |
| Maximum | 10.9% | 9.1% |
| Range | 8.3% | 7.3% |
| Mean | 5.8% | 5.5% |
| Median | 5.2% | 5.4% |
| Interquartile 25% (IQ1) | 4.3% | 4.8% |
| Interquartile 75% (IQ3) | 6.1% | 6.3% |
| Interquartile Range (IQR) | 1.8% | 1.5% |
| Standard Deviation (Sample) | 2.3% | 1.3% |
| Standard Deviation (Population) | 2.2% | 1.2% |
Demographics Similar to Immigrants from Bulgaria and Sierra Leoneans by Ambulatory Disability
In terms of ambulatory disability, the demographic groups most similar to Immigrants from Bulgaria are Immigrants from Eastern Africa (5.6%, a difference of 0.070%), Inupiat (5.6%, a difference of 0.090%), Immigrants from Egypt (5.6%, a difference of 0.11%), Jordanian (5.6%, a difference of 0.12%), and Immigrants from Brazil (5.6%, a difference of 0.33%). Similarly, the demographic groups most similar to Sierra Leoneans are Immigrants from Peru (5.7%, a difference of 0.090%), Brazilian (5.7%, a difference of 0.11%), Peruvian (5.7%, a difference of 0.23%), Sri Lankan (5.7%, a difference of 0.67%), and Immigrants from Uganda (5.7%, a difference of 0.69%).
| Demographics | Rating | Rank | Ambulatory Disability |
| Jordanians | 99.8 /100 | #52 | Exceptional 5.6% |
| Immigrants | Egypt | 99.8 /100 | #53 | Exceptional 5.6% |
| Immigrants | Eastern Africa | 99.8 /100 | #54 | Exceptional 5.6% |
| Immigrants | Bulgaria | 99.8 /100 | #55 | Exceptional 5.6% |
| Inupiat | 99.8 /100 | #56 | Exceptional 5.6% |
| Immigrants | Brazil | 99.8 /100 | #57 | Exceptional 5.6% |
| Immigrants | Zimbabwe | 99.8 /100 | #58 | Exceptional 5.6% |
| Immigrants | Afghanistan | 99.8 /100 | #59 | Exceptional 5.6% |
| Immigrants | Lithuania | 99.8 /100 | #60 | Exceptional 5.6% |
| Immigrants | Belgium | 99.7 /100 | #61 | Exceptional 5.6% |
| Immigrants | Spain | 99.7 /100 | #62 | Exceptional 5.6% |
| Immigrants | France | 99.7 /100 | #63 | Exceptional 5.6% |
| Laotians | 99.7 /100 | #64 | Exceptional 5.7% |
| Immigrants | Switzerland | 99.7 /100 | #65 | Exceptional 5.7% |
| Israelis | 99.6 /100 | #66 | Exceptional 5.7% |
| Immigrants | Uganda | 99.6 /100 | #67 | Exceptional 5.7% |
| Sri Lankans | 99.6 /100 | #68 | Exceptional 5.7% |
| Peruvians | 99.5 /100 | #69 | Exceptional 5.7% |
| Sierra Leoneans | 99.4 /100 | #70 | Exceptional 5.7% |
| Immigrants | Peru | 99.4 /100 | #71 | Exceptional 5.7% |
| Brazilians | 99.4 /100 | #72 | Exceptional 5.7% |