Immigrants from Bulgaria vs Creek Poverty
COMPARE
Immigrants from Bulgaria
Creek
Poverty
Poverty Comparison
Immigrants from Bulgaria
Creek
11.1%
POVERTY
98.5/ 100
METRIC RATING
54th/ 347
METRIC RANK
15.6%
POVERTY
0.0/ 100
METRIC RATING
306th/ 347
METRIC RANK
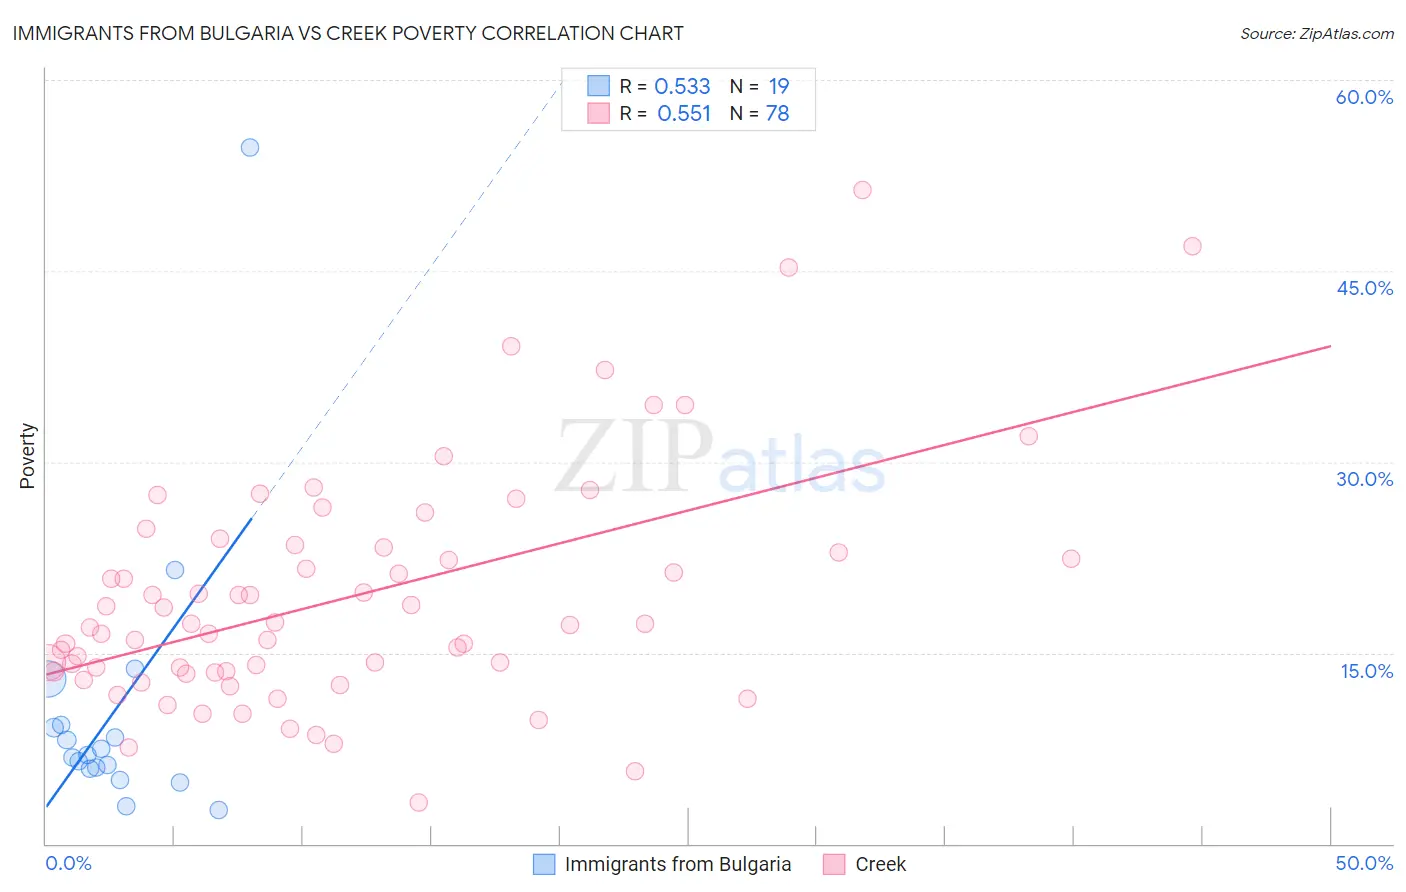
Immigrants from Bulgaria vs Creek Poverty Correlation Chart
The statistical analysis conducted on geographies consisting of 172,536,486 people shows a substantial positive correlation between the proportion of Immigrants from Bulgaria and poverty level in the United States with a correlation coefficient (R) of 0.533 and weighted average of 11.1%. Similarly, the statistical analysis conducted on geographies consisting of 178,440,498 people shows a substantial positive correlation between the proportion of Creek and poverty level in the United States with a correlation coefficient (R) of 0.551 and weighted average of 15.6%, a difference of 40.7%.
Poverty Correlation Summary
| Measurement | Immigrants from Bulgaria | Creek |
| Minimum | 2.7% | 3.2% |
| Maximum | 54.7% | 51.4% |
| Range | 52.0% | 48.1% |
| Mean | 10.5% | 19.4% |
| Median | 7.0% | 17.2% |
| Interquartile 25% (IQ1) | 5.8% | 13.5% |
| Interquartile 75% (IQ3) | 9.4% | 23.3% |
| Interquartile Range (IQR) | 3.5% | 9.7% |
| Standard Deviation (Sample) | 11.5% | 9.2% |
| Standard Deviation (Population) | 11.2% | 9.2% |
Similar Demographics by Poverty
Demographics Similar to Immigrants from Bulgaria by Poverty
In terms of poverty, the demographic groups most similar to Immigrants from Bulgaria are Immigrants from Serbia (11.1%, a difference of 0.030%), Immigrants from Austria (11.1%, a difference of 0.12%), Immigrants from Philippines (11.0%, a difference of 0.34%), Immigrants from Croatia (11.0%, a difference of 0.36%), and Estonian (11.1%, a difference of 0.51%).
| Demographics | Rating | Rank | Poverty |
| Immigrants | Romania | 98.9 /100 | #47 | Exceptional 11.0% |
| Slovenes | 98.9 /100 | #48 | Exceptional 11.0% |
| Immigrants | Japan | 98.9 /100 | #49 | Exceptional 11.0% |
| Asians | 98.9 /100 | #50 | Exceptional 11.0% |
| Immigrants | Croatia | 98.7 /100 | #51 | Exceptional 11.0% |
| Immigrants | Philippines | 98.7 /100 | #52 | Exceptional 11.0% |
| Immigrants | Austria | 98.6 /100 | #53 | Exceptional 11.1% |
| Immigrants | Bulgaria | 98.5 /100 | #54 | Exceptional 11.1% |
| Immigrants | Serbia | 98.5 /100 | #55 | Exceptional 11.1% |
| Estonians | 98.2 /100 | #56 | Exceptional 11.1% |
| Scandinavians | 98.2 /100 | #57 | Exceptional 11.1% |
| Germans | 98.1 /100 | #58 | Exceptional 11.1% |
| Immigrants | Europe | 98.0 /100 | #59 | Exceptional 11.2% |
| Immigrants | Sri Lanka | 97.9 /100 | #60 | Exceptional 11.2% |
| Immigrants | Italy | 97.9 /100 | #61 | Exceptional 11.2% |
Demographics Similar to Creek by Poverty
In terms of poverty, the demographic groups most similar to Creek are African (15.6%, a difference of 0.070%), Choctaw (15.6%, a difference of 0.18%), Seminole (15.6%, a difference of 0.23%), Dutch West Indian (15.6%, a difference of 0.32%), and Immigrants from Guatemala (15.5%, a difference of 0.44%).
| Demographics | Rating | Rank | Poverty |
| Senegalese | 0.0 /100 | #299 | Tragic 15.3% |
| Immigrants | Central America | 0.0 /100 | #300 | Tragic 15.4% |
| Bahamians | 0.0 /100 | #301 | Tragic 15.4% |
| Somalis | 0.0 /100 | #302 | Tragic 15.4% |
| Immigrants | Caribbean | 0.0 /100 | #303 | Tragic 15.5% |
| Immigrants | Mexico | 0.0 /100 | #304 | Tragic 15.5% |
| Immigrants | Guatemala | 0.0 /100 | #305 | Tragic 15.5% |
| Creek | 0.0 /100 | #306 | Tragic 15.6% |
| Africans | 0.0 /100 | #307 | Tragic 15.6% |
| Choctaw | 0.0 /100 | #308 | Tragic 15.6% |
| Seminole | 0.0 /100 | #309 | Tragic 15.6% |
| Dutch West Indians | 0.0 /100 | #310 | Tragic 15.6% |
| Chippewa | 0.0 /100 | #311 | Tragic 15.7% |
| Cajuns | 0.0 /100 | #312 | Tragic 15.7% |
| Immigrants | Grenada | 0.0 /100 | #313 | Tragic 15.8% |