Hungarian vs Immigrants from Uruguay Disability Age 5 to 17
COMPARE
Hungarian
Immigrants from Uruguay
Disability Age 5 to 17
Disability Age 5 to 17 Comparison
Hungarians
Immigrants from Uruguay
5.8%
DISABILITY AGE 5 TO 17
2.6/ 100
METRIC RATING
238th/ 347
METRIC RANK
5.6%
DISABILITY AGE 5 TO 17
37.7/ 100
METRIC RATING
180th/ 347
METRIC RANK
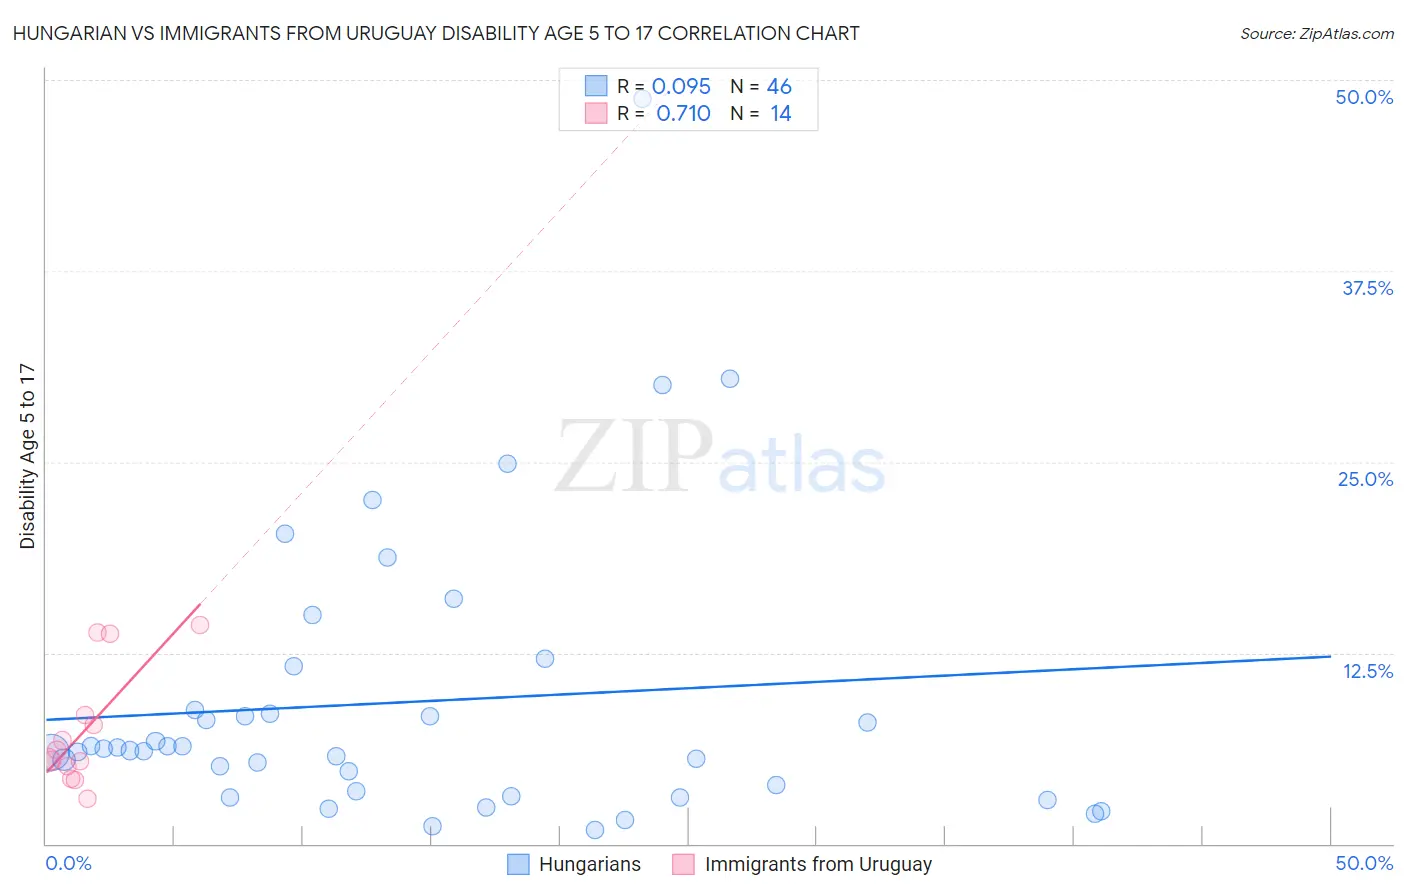
Hungarian vs Immigrants from Uruguay Disability Age 5 to 17 Correlation Chart
The statistical analysis conducted on geographies consisting of 479,147,501 people shows a slight positive correlation between the proportion of Hungarians and percentage of population with a disability between the ages 5 and 17 in the United States with a correlation coefficient (R) of 0.095 and weighted average of 5.8%. Similarly, the statistical analysis conducted on geographies consisting of 132,989,103 people shows a strong positive correlation between the proportion of Immigrants from Uruguay and percentage of population with a disability between the ages 5 and 17 in the United States with a correlation coefficient (R) of 0.710 and weighted average of 5.6%, a difference of 3.8%.
Disability Age 5 to 17 Correlation Summary
| Measurement | Hungarian | Immigrants from Uruguay |
| Minimum | 0.90% | 3.0% |
| Maximum | 48.8% | 14.3% |
| Range | 47.9% | 11.3% |
| Mean | 9.3% | 7.4% |
| Median | 6.2% | 5.8% |
| Interquartile 25% (IQ1) | 3.5% | 5.1% |
| Interquartile 75% (IQ3) | 8.7% | 8.4% |
| Interquartile Range (IQR) | 5.3% | 3.3% |
| Standard Deviation (Sample) | 9.4% | 3.8% |
| Standard Deviation (Population) | 9.3% | 3.7% |
Similar Demographics by Disability Age 5 to 17
Demographics Similar to Hungarians by Disability Age 5 to 17
In terms of disability age 5 to 17, the demographic groups most similar to Hungarians are Sudanese (5.8%, a difference of 0.10%), German Russian (5.9%, a difference of 0.10%), West Indian (5.9%, a difference of 0.12%), Immigrants from Brazil (5.8%, a difference of 0.25%), and Immigrants from Caribbean (5.9%, a difference of 0.26%).
| Demographics | Rating | Rank | Disability Age 5 to 17 |
| Europeans | 4.5 /100 | #231 | Tragic 5.8% |
| Immigrants | Laos | 3.8 /100 | #232 | Tragic 5.8% |
| Immigrants | West Indies | 3.5 /100 | #233 | Tragic 5.8% |
| Immigrants | Kenya | 3.4 /100 | #234 | Tragic 5.8% |
| Malaysians | 3.4 /100 | #235 | Tragic 5.8% |
| Immigrants | Brazil | 3.2 /100 | #236 | Tragic 5.8% |
| Sudanese | 2.9 /100 | #237 | Tragic 5.8% |
| Hungarians | 2.6 /100 | #238 | Tragic 5.8% |
| German Russians | 2.4 /100 | #239 | Tragic 5.9% |
| West Indians | 2.4 /100 | #240 | Tragic 5.9% |
| Immigrants | Caribbean | 2.1 /100 | #241 | Tragic 5.9% |
| Spaniards | 2.0 /100 | #242 | Tragic 5.9% |
| Indonesians | 2.0 /100 | #243 | Tragic 5.9% |
| Immigrants | Germany | 1.9 /100 | #244 | Tragic 5.9% |
| Immigrants | Micronesia | 1.9 /100 | #245 | Tragic 5.9% |
Demographics Similar to Immigrants from Uruguay by Disability Age 5 to 17
In terms of disability age 5 to 17, the demographic groups most similar to Immigrants from Uruguay are Immigrants from England (5.6%, a difference of 0.070%), Mexican American Indian (5.6%, a difference of 0.13%), Immigrants from Barbados (5.6%, a difference of 0.14%), Immigrants from Latin America (5.6%, a difference of 0.18%), and Syrian (5.6%, a difference of 0.21%).
| Demographics | Rating | Rank | Disability Age 5 to 17 |
| Uruguayans | 51.0 /100 | #173 | Average 5.6% |
| Costa Ricans | 50.0 /100 | #174 | Average 5.6% |
| Shoshone | 49.4 /100 | #175 | Average 5.6% |
| Immigrants | Central America | 49.4 /100 | #176 | Average 5.6% |
| Immigrants | Western Europe | 47.8 /100 | #177 | Average 5.6% |
| Immigrants | Trinidad and Tobago | 47.6 /100 | #178 | Average 5.6% |
| Immigrants | Barbados | 40.5 /100 | #179 | Average 5.6% |
| Immigrants | Uruguay | 37.7 /100 | #180 | Fair 5.6% |
| Immigrants | England | 36.4 /100 | #181 | Fair 5.6% |
| Mexican American Indians | 35.2 /100 | #182 | Fair 5.6% |
| Immigrants | Latin America | 34.3 /100 | #183 | Fair 5.6% |
| Syrians | 33.8 /100 | #184 | Fair 5.6% |
| Immigrants | Mexico | 33.7 /100 | #185 | Fair 5.6% |
| Fijians | 31.7 /100 | #186 | Fair 5.7% |
| Immigrants | Thailand | 30.2 /100 | #187 | Fair 5.7% |