Hungarian vs Immigrants from the Azores Disability Age 5 to 17
COMPARE
Hungarian
Immigrants from the Azores
Disability Age 5 to 17
Disability Age 5 to 17 Comparison
Hungarians
Immigrants from the Azores
5.8%
DISABILITY AGE 5 TO 17
2.6/ 100
METRIC RATING
238th/ 347
METRIC RANK
6.7%
DISABILITY AGE 5 TO 17
0.0/ 100
METRIC RATING
332nd/ 347
METRIC RANK
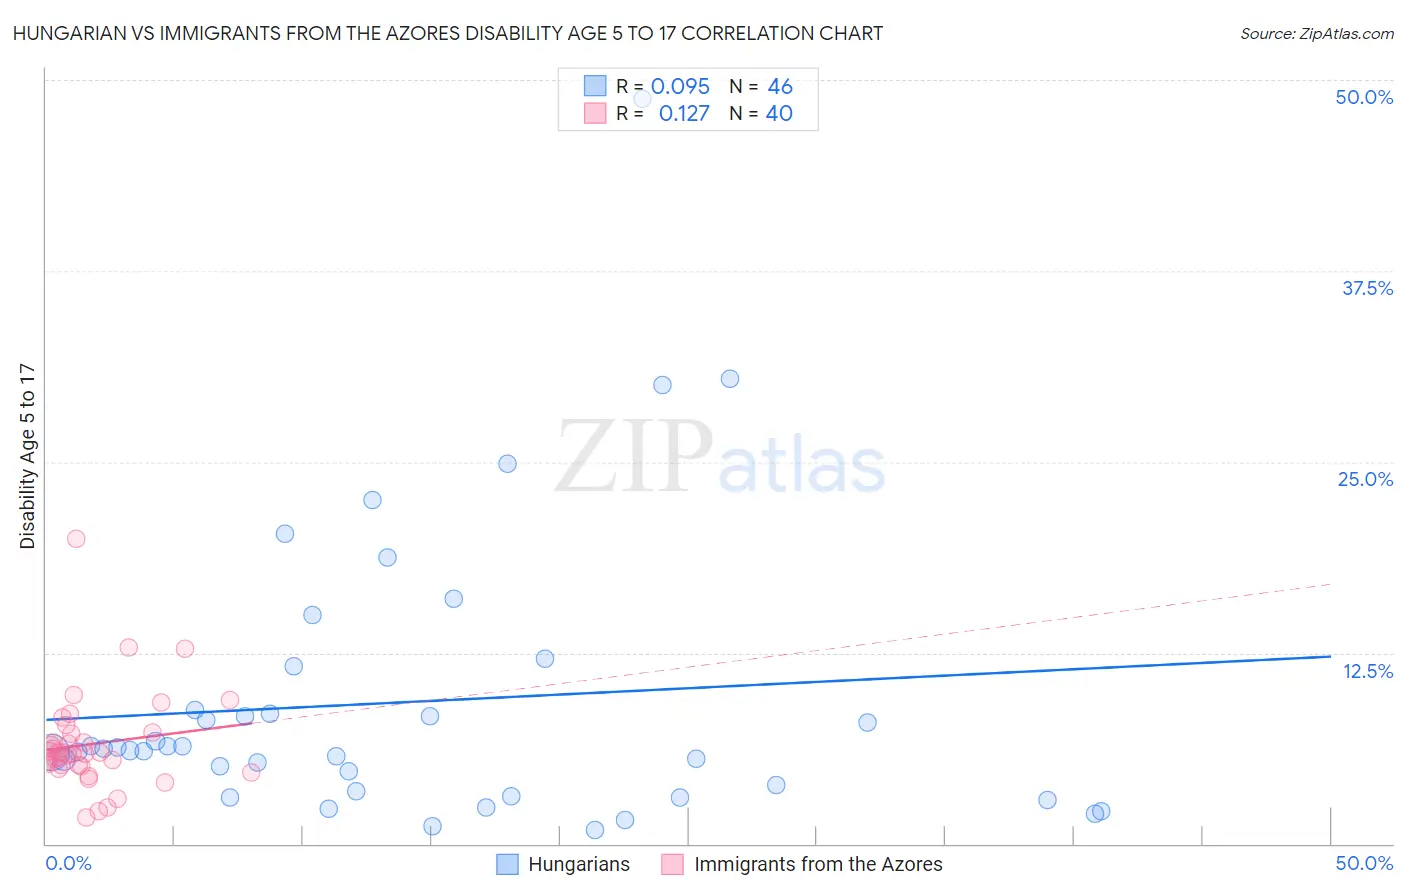
Hungarian vs Immigrants from the Azores Disability Age 5 to 17 Correlation Chart
The statistical analysis conducted on geographies consisting of 479,147,501 people shows a slight positive correlation between the proportion of Hungarians and percentage of population with a disability between the ages 5 and 17 in the United States with a correlation coefficient (R) of 0.095 and weighted average of 5.8%. Similarly, the statistical analysis conducted on geographies consisting of 46,157,711 people shows a poor positive correlation between the proportion of Immigrants from the Azores and percentage of population with a disability between the ages 5 and 17 in the United States with a correlation coefficient (R) of 0.127 and weighted average of 6.7%, a difference of 14.8%.
Disability Age 5 to 17 Correlation Summary
| Measurement | Hungarian | Immigrants from the Azores |
| Minimum | 0.90% | 1.8% |
| Maximum | 48.8% | 20.0% |
| Range | 47.9% | 18.2% |
| Mean | 9.3% | 6.5% |
| Median | 6.2% | 5.9% |
| Interquartile 25% (IQ1) | 3.5% | 5.1% |
| Interquartile 75% (IQ3) | 8.7% | 7.3% |
| Interquartile Range (IQR) | 5.3% | 2.1% |
| Standard Deviation (Sample) | 9.4% | 3.2% |
| Standard Deviation (Population) | 9.3% | 3.2% |
Similar Demographics by Disability Age 5 to 17
Demographics Similar to Hungarians by Disability Age 5 to 17
In terms of disability age 5 to 17, the demographic groups most similar to Hungarians are Sudanese (5.8%, a difference of 0.10%), German Russian (5.9%, a difference of 0.10%), West Indian (5.9%, a difference of 0.12%), Immigrants from Brazil (5.8%, a difference of 0.25%), and Immigrants from Caribbean (5.9%, a difference of 0.26%).
| Demographics | Rating | Rank | Disability Age 5 to 17 |
| Europeans | 4.5 /100 | #231 | Tragic 5.8% |
| Immigrants | Laos | 3.8 /100 | #232 | Tragic 5.8% |
| Immigrants | West Indies | 3.5 /100 | #233 | Tragic 5.8% |
| Immigrants | Kenya | 3.4 /100 | #234 | Tragic 5.8% |
| Malaysians | 3.4 /100 | #235 | Tragic 5.8% |
| Immigrants | Brazil | 3.2 /100 | #236 | Tragic 5.8% |
| Sudanese | 2.9 /100 | #237 | Tragic 5.8% |
| Hungarians | 2.6 /100 | #238 | Tragic 5.8% |
| German Russians | 2.4 /100 | #239 | Tragic 5.9% |
| West Indians | 2.4 /100 | #240 | Tragic 5.9% |
| Immigrants | Caribbean | 2.1 /100 | #241 | Tragic 5.9% |
| Spaniards | 2.0 /100 | #242 | Tragic 5.9% |
| Indonesians | 2.0 /100 | #243 | Tragic 5.9% |
| Immigrants | Germany | 1.9 /100 | #244 | Tragic 5.9% |
| Immigrants | Micronesia | 1.9 /100 | #245 | Tragic 5.9% |
Demographics Similar to Immigrants from the Azores by Disability Age 5 to 17
In terms of disability age 5 to 17, the demographic groups most similar to Immigrants from the Azores are French Canadian (6.7%, a difference of 0.020%), Dutch West Indian (6.7%, a difference of 0.10%), Black/African American (6.8%, a difference of 0.59%), Seminole (6.8%, a difference of 0.64%), and Ottawa (6.8%, a difference of 1.3%).
| Demographics | Rating | Rank | Disability Age 5 to 17 |
| Americans | 0.0 /100 | #325 | Tragic 6.5% |
| Potawatomi | 0.0 /100 | #326 | Tragic 6.5% |
| French American Indians | 0.0 /100 | #327 | Tragic 6.6% |
| Pennsylvania Germans | 0.0 /100 | #328 | Tragic 6.6% |
| Blackfeet | 0.0 /100 | #329 | Tragic 6.6% |
| Dutch West Indians | 0.0 /100 | #330 | Tragic 6.7% |
| French Canadians | 0.0 /100 | #331 | Tragic 6.7% |
| Immigrants | Azores | 0.0 /100 | #332 | Tragic 6.7% |
| Blacks/African Americans | 0.0 /100 | #333 | Tragic 6.8% |
| Seminole | 0.0 /100 | #334 | Tragic 6.8% |
| Ottawa | 0.0 /100 | #335 | Tragic 6.8% |
| Chickasaw | 0.0 /100 | #336 | Tragic 6.8% |
| Creek | 0.0 /100 | #337 | Tragic 6.9% |
| Iroquois | 0.0 /100 | #338 | Tragic 6.9% |
| Choctaw | 0.0 /100 | #339 | Tragic 6.9% |