Hungarian vs Korean Disability Age 5 to 17
COMPARE
Hungarian
Korean
Disability Age 5 to 17
Disability Age 5 to 17 Comparison
Hungarians
Koreans
5.8%
DISABILITY AGE 5 TO 17
2.6/ 100
METRIC RATING
238th/ 347
METRIC RANK
5.1%
DISABILITY AGE 5 TO 17
100.0/ 100
METRIC RATING
48th/ 347
METRIC RANK
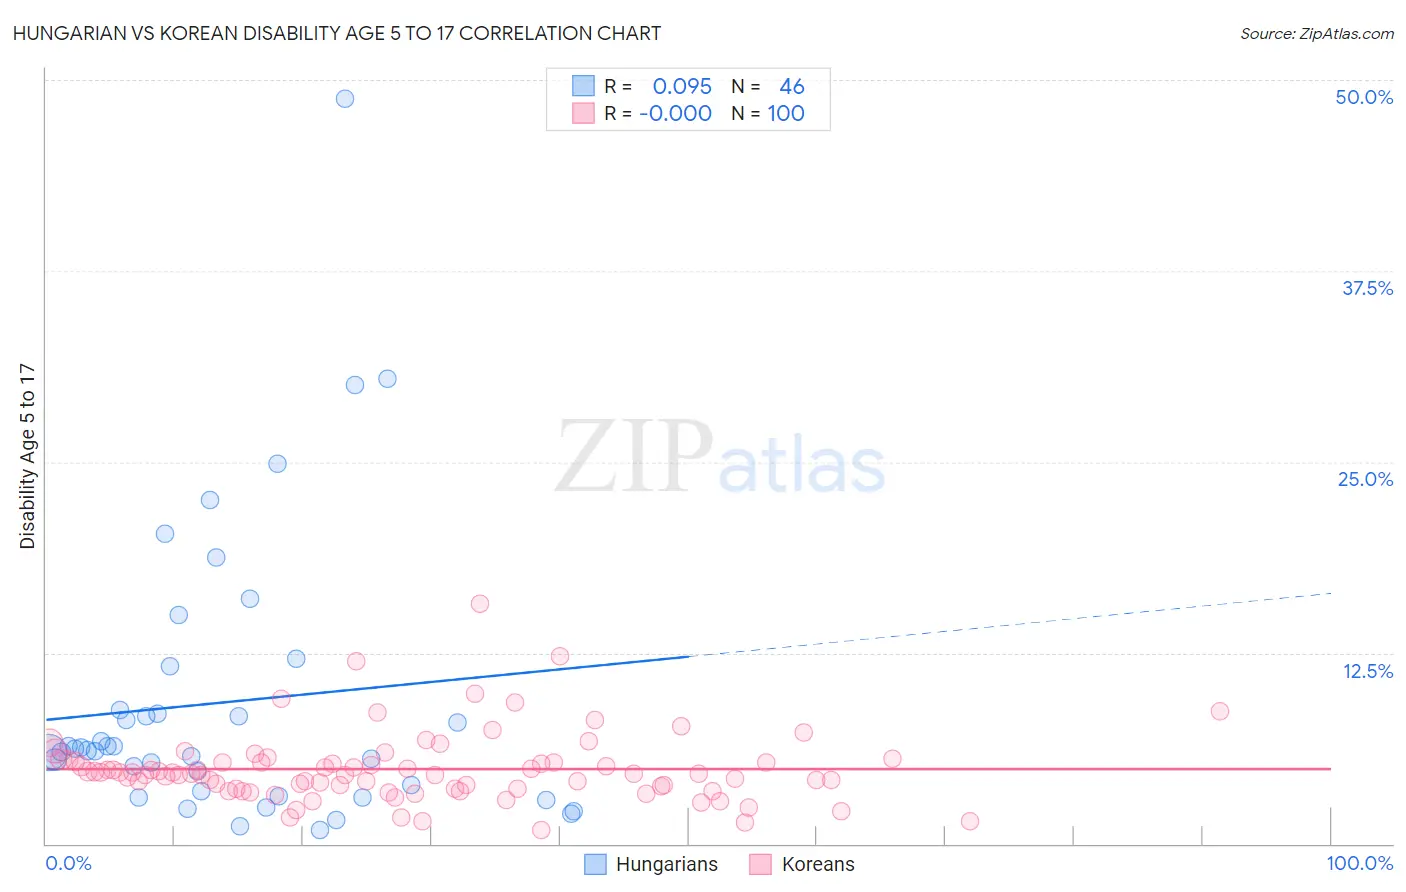
Hungarian vs Korean Disability Age 5 to 17 Correlation Chart
The statistical analysis conducted on geographies consisting of 479,147,501 people shows a slight positive correlation between the proportion of Hungarians and percentage of population with a disability between the ages 5 and 17 in the United States with a correlation coefficient (R) of 0.095 and weighted average of 5.8%. Similarly, the statistical analysis conducted on geographies consisting of 504,185,597 people shows no correlation between the proportion of Koreans and percentage of population with a disability between the ages 5 and 17 in the United States with a correlation coefficient (R) of -0.000 and weighted average of 5.1%, a difference of 15.6%.
Disability Age 5 to 17 Correlation Summary
| Measurement | Hungarian | Korean |
| Minimum | 0.90% | 0.91% |
| Maximum | 48.8% | 15.7% |
| Range | 47.9% | 14.8% |
| Mean | 9.3% | 4.9% |
| Median | 6.2% | 4.6% |
| Interquartile 25% (IQ1) | 3.5% | 3.6% |
| Interquartile 75% (IQ3) | 8.7% | 5.4% |
| Interquartile Range (IQR) | 5.3% | 1.8% |
| Standard Deviation (Sample) | 9.4% | 2.3% |
| Standard Deviation (Population) | 9.3% | 2.3% |
Similar Demographics by Disability Age 5 to 17
Demographics Similar to Hungarians by Disability Age 5 to 17
In terms of disability age 5 to 17, the demographic groups most similar to Hungarians are Sudanese (5.8%, a difference of 0.10%), German Russian (5.9%, a difference of 0.10%), West Indian (5.9%, a difference of 0.12%), Immigrants from Brazil (5.8%, a difference of 0.25%), and Immigrants from Caribbean (5.9%, a difference of 0.26%).
| Demographics | Rating | Rank | Disability Age 5 to 17 |
| Europeans | 4.5 /100 | #231 | Tragic 5.8% |
| Immigrants | Laos | 3.8 /100 | #232 | Tragic 5.8% |
| Immigrants | West Indies | 3.5 /100 | #233 | Tragic 5.8% |
| Immigrants | Kenya | 3.4 /100 | #234 | Tragic 5.8% |
| Malaysians | 3.4 /100 | #235 | Tragic 5.8% |
| Immigrants | Brazil | 3.2 /100 | #236 | Tragic 5.8% |
| Sudanese | 2.9 /100 | #237 | Tragic 5.8% |
| Hungarians | 2.6 /100 | #238 | Tragic 5.8% |
| German Russians | 2.4 /100 | #239 | Tragic 5.9% |
| West Indians | 2.4 /100 | #240 | Tragic 5.9% |
| Immigrants | Caribbean | 2.1 /100 | #241 | Tragic 5.9% |
| Spaniards | 2.0 /100 | #242 | Tragic 5.9% |
| Indonesians | 2.0 /100 | #243 | Tragic 5.9% |
| Immigrants | Germany | 1.9 /100 | #244 | Tragic 5.9% |
| Immigrants | Micronesia | 1.9 /100 | #245 | Tragic 5.9% |
Demographics Similar to Koreans by Disability Age 5 to 17
In terms of disability age 5 to 17, the demographic groups most similar to Koreans are Immigrants from Western Asia (5.1%, a difference of 0.080%), Vietnamese (5.1%, a difference of 0.18%), Assyrian/Chaldean/Syriac (5.0%, a difference of 0.31%), Tongan (5.0%, a difference of 0.38%), and Egyptian (5.0%, a difference of 0.45%).
| Demographics | Rating | Rank | Disability Age 5 to 17 |
| Immigrants | Australia | 100.0 /100 | #41 | Exceptional 5.0% |
| Immigrants | Sri Lanka | 100.0 /100 | #42 | Exceptional 5.0% |
| Immigrants | Russia | 100.0 /100 | #43 | Exceptional 5.0% |
| Egyptians | 100.0 /100 | #44 | Exceptional 5.0% |
| Tongans | 100.0 /100 | #45 | Exceptional 5.0% |
| Assyrians/Chaldeans/Syriacs | 100.0 /100 | #46 | Exceptional 5.0% |
| Vietnamese | 100.0 /100 | #47 | Exceptional 5.1% |
| Koreans | 100.0 /100 | #48 | Exceptional 5.1% |
| Immigrants | Western Asia | 100.0 /100 | #49 | Exceptional 5.1% |
| Argentineans | 99.9 /100 | #50 | Exceptional 5.1% |
| Turks | 99.9 /100 | #51 | Exceptional 5.1% |
| Immigrants | Fiji | 99.9 /100 | #52 | Exceptional 5.1% |
| Immigrants | Lithuania | 99.9 /100 | #53 | Exceptional 5.1% |
| Paraguayans | 99.9 /100 | #54 | Exceptional 5.1% |
| Laotians | 99.9 /100 | #55 | Exceptional 5.1% |