Houma vs Chippewa Vision Disability
COMPARE
Houma
Chippewa
Vision Disability
Vision Disability Comparison
Houma
Chippewa
3.4%
VISION DISABILITY
0.0/ 100
METRIC RATING
346th/ 347
METRIC RANK
2.4%
VISION DISABILITY
0.0/ 100
METRIC RATING
275th/ 347
METRIC RANK
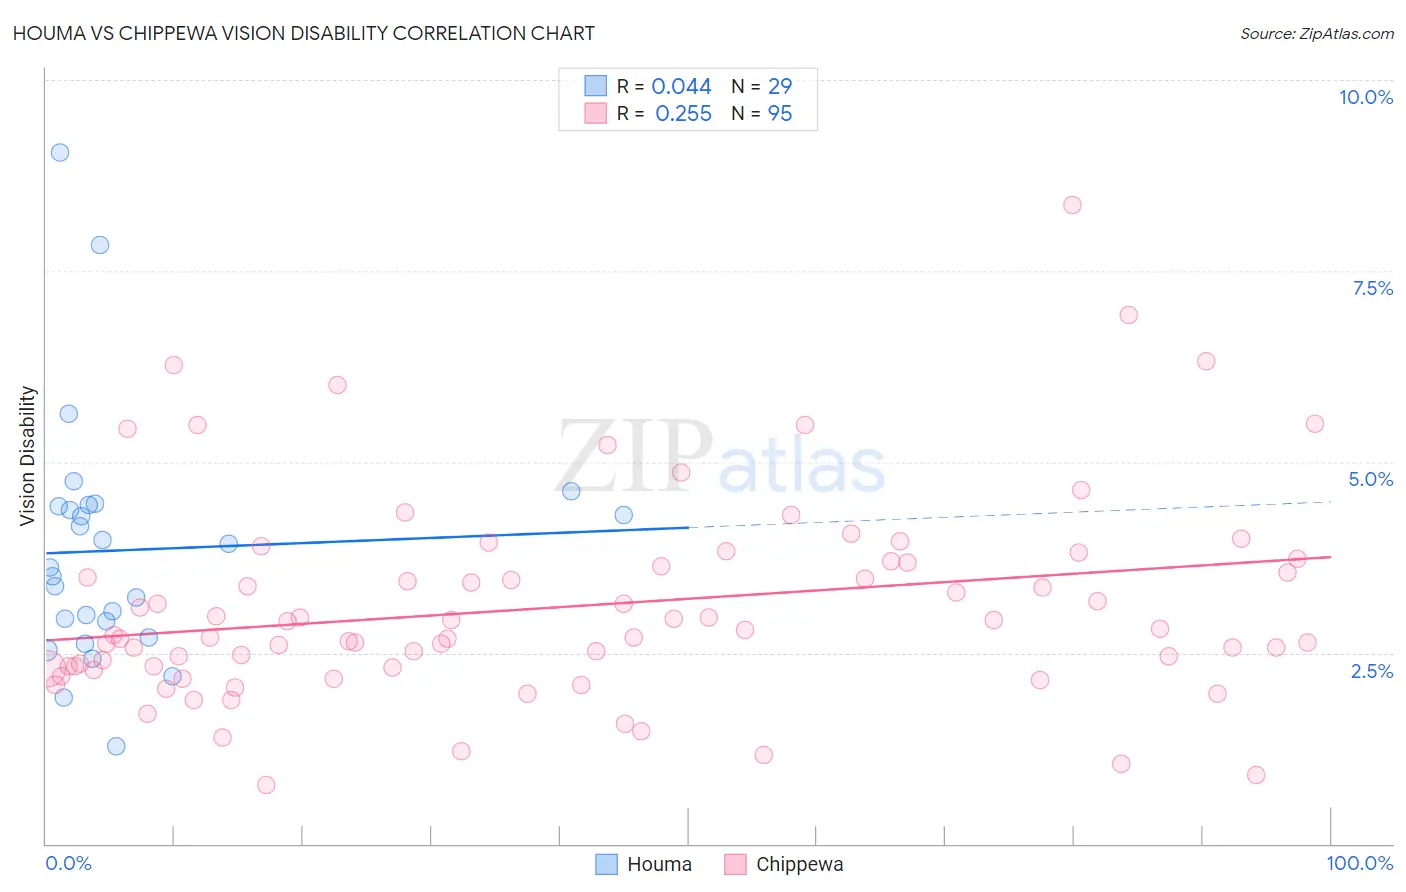
Houma vs Chippewa Vision Disability Correlation Chart
The statistical analysis conducted on geographies consisting of 36,790,703 people shows no correlation between the proportion of Houma and percentage of population with vision disability in the United States with a correlation coefficient (R) of 0.044 and weighted average of 3.4%. Similarly, the statistical analysis conducted on geographies consisting of 214,949,512 people shows a weak positive correlation between the proportion of Chippewa and percentage of population with vision disability in the United States with a correlation coefficient (R) of 0.255 and weighted average of 2.4%, a difference of 41.2%.
Vision Disability Correlation Summary
| Measurement | Houma | Chippewa |
| Minimum | 1.3% | 0.77% |
| Maximum | 9.0% | 8.4% |
| Range | 7.8% | 7.6% |
| Mean | 3.8% | 3.1% |
| Median | 3.6% | 2.7% |
| Interquartile 25% (IQ1) | 2.8% | 2.3% |
| Interquartile 75% (IQ3) | 4.4% | 3.7% |
| Interquartile Range (IQR) | 1.6% | 1.4% |
| Standard Deviation (Sample) | 1.6% | 1.3% |
| Standard Deviation (Population) | 1.6% | 1.3% |
Similar Demographics by Vision Disability
Demographics Similar to Houma by Vision Disability
In terms of vision disability, the demographic groups most similar to Houma are Lumbee (3.4%, a difference of 1.7%), Pueblo (3.3%, a difference of 3.3%), Pima (3.3%, a difference of 3.3%), Choctaw (3.3%, a difference of 4.4%), and Kiowa (3.3%, a difference of 5.9%).
| Demographics | Rating | Rank | Vision Disability |
| Cajuns | 0.0 /100 | #333 | Tragic 3.1% |
| Cheyenne | 0.0 /100 | #334 | Tragic 3.1% |
| Navajo | 0.0 /100 | #335 | Tragic 3.1% |
| Alaskan Athabascans | 0.0 /100 | #336 | Tragic 3.1% |
| Dutch West Indians | 0.0 /100 | #337 | Tragic 3.2% |
| Chickasaw | 0.0 /100 | #338 | Tragic 3.2% |
| Tsimshian | 0.0 /100 | #339 | Tragic 3.2% |
| Creek | 0.0 /100 | #340 | Tragic 3.2% |
| Kiowa | 0.0 /100 | #341 | Tragic 3.3% |
| Choctaw | 0.0 /100 | #342 | Tragic 3.3% |
| Pima | 0.0 /100 | #343 | Tragic 3.3% |
| Pueblo | 0.0 /100 | #344 | Tragic 3.3% |
| Lumbee | 0.0 /100 | #345 | Tragic 3.4% |
| Houma | 0.0 /100 | #346 | Tragic 3.4% |
| Puerto Ricans | 0.0 /100 | #347 | Tragic 3.9% |
Demographics Similar to Chippewa by Vision Disability
In terms of vision disability, the demographic groups most similar to Chippewa are Scotch-Irish (2.4%, a difference of 0.090%), Bahamian (2.4%, a difference of 0.13%), Spanish (2.4%, a difference of 0.29%), Nepalese (2.4%, a difference of 0.30%), and Immigrants from Latin America (2.4%, a difference of 0.32%).
| Demographics | Rating | Rank | Vision Disability |
| Senegalese | 0.1 /100 | #268 | Tragic 2.4% |
| Celtics | 0.1 /100 | #269 | Tragic 2.4% |
| Cubans | 0.1 /100 | #270 | Tragic 2.4% |
| Immigrants | Azores | 0.1 /100 | #271 | Tragic 2.4% |
| Spaniards | 0.1 /100 | #272 | Tragic 2.4% |
| Immigrants | Bahamas | 0.1 /100 | #273 | Tragic 2.4% |
| Immigrants | Latin America | 0.0 /100 | #274 | Tragic 2.4% |
| Chippewa | 0.0 /100 | #275 | Tragic 2.4% |
| Scotch-Irish | 0.0 /100 | #276 | Tragic 2.4% |
| Bahamians | 0.0 /100 | #277 | Tragic 2.4% |
| Spanish | 0.0 /100 | #278 | Tragic 2.4% |
| Nepalese | 0.0 /100 | #279 | Tragic 2.4% |
| Cape Verdeans | 0.0 /100 | #280 | Tragic 2.4% |
| U.S. Virgin Islanders | 0.0 /100 | #281 | Tragic 2.5% |
| Immigrants | Caribbean | 0.0 /100 | #282 | Tragic 2.5% |