Houma vs Chippewa Median Earnings
COMPARE
Houma
Chippewa
Median Earnings
Median Earnings Comparison
Houma
Chippewa
$38,949
MEDIAN EARNINGS
0.0/ 100
METRIC RATING
333rd/ 347
METRIC RANK
$40,287
MEDIAN EARNINGS
0.0/ 100
METRIC RATING
312th/ 347
METRIC RANK
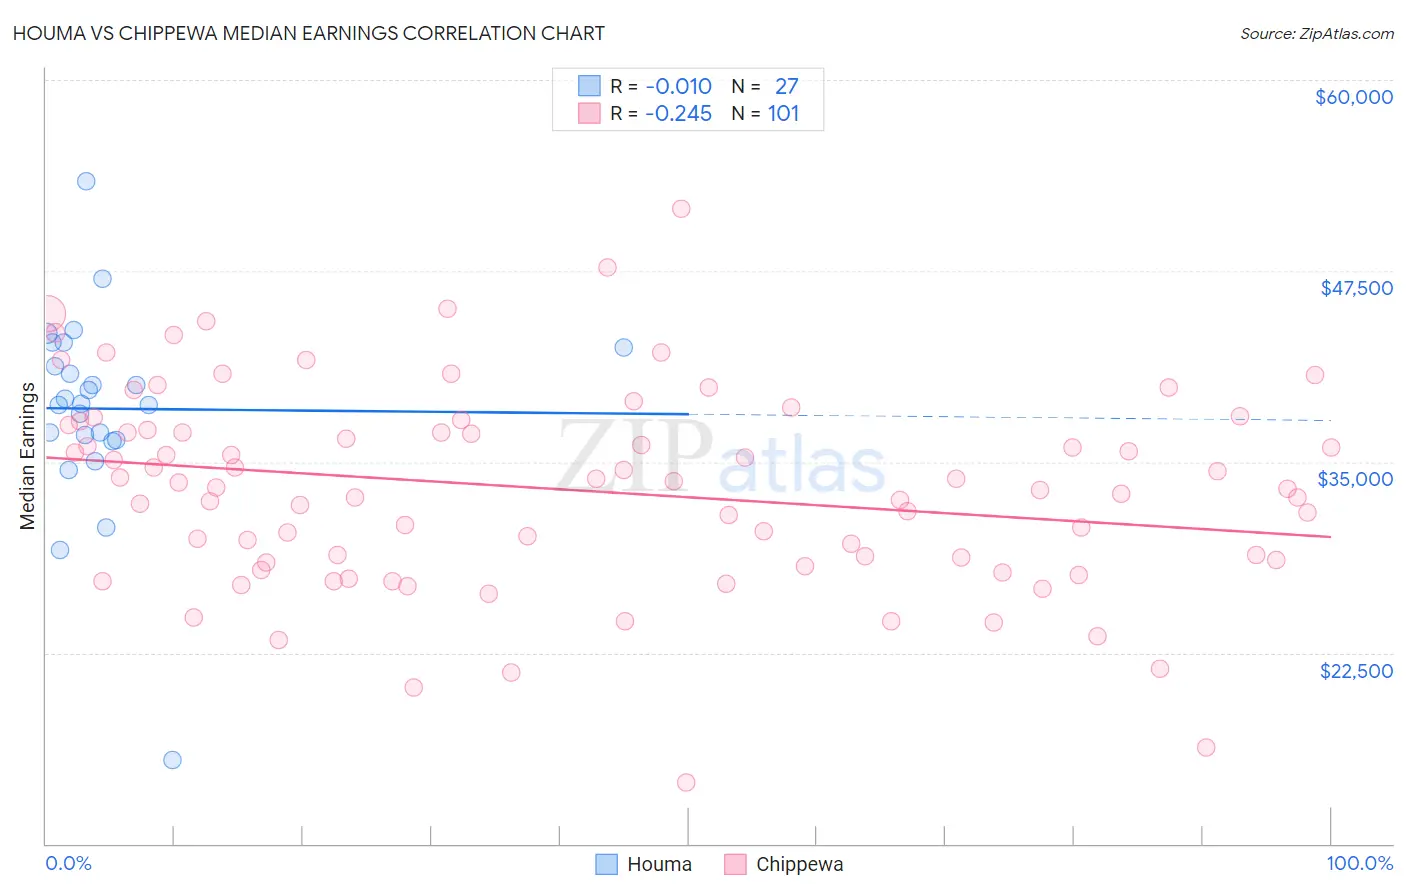
Houma vs Chippewa Median Earnings Correlation Chart
The statistical analysis conducted on geographies consisting of 36,796,366 people shows no correlation between the proportion of Houma and median earnings in the United States with a correlation coefficient (R) of -0.010 and weighted average of $38,949. Similarly, the statistical analysis conducted on geographies consisting of 215,041,296 people shows a weak negative correlation between the proportion of Chippewa and median earnings in the United States with a correlation coefficient (R) of -0.245 and weighted average of $40,287, a difference of 3.4%.
Median Earnings Correlation Summary
| Measurement | Houma | Chippewa |
| Minimum | $15,495 | $14,000 |
| Maximum | $53,358 | $51,563 |
| Range | $37,863 | $37,563 |
| Mean | $38,485 | $33,174 |
| Median | $38,771 | $33,342 |
| Interquartile 25% (IQ1) | $36,392 | $28,488 |
| Interquartile 75% (IQ3) | $42,500 | $37,270 |
| Interquartile Range (IQR) | $6,108 | $8,782 |
| Standard Deviation (Sample) | $6,619 | $6,612 |
| Standard Deviation (Population) | $6,495 | $6,579 |
Similar Demographics by Median Earnings
Demographics Similar to Houma by Median Earnings
In terms of median earnings, the demographic groups most similar to Houma are Spanish American Indian ($38,907, a difference of 0.11%), Native/Alaskan ($38,896, a difference of 0.14%), Yakama ($39,107, a difference of 0.41%), Immigrants from Mexico ($39,114, a difference of 0.42%), and Immigrants from Congo ($39,169, a difference of 0.57%).
| Demographics | Rating | Rank | Median Earnings |
| Immigrants | Yemen | 0.0 /100 | #326 | Tragic $39,540 |
| Yuman | 0.0 /100 | #327 | Tragic $39,523 |
| Sioux | 0.0 /100 | #328 | Tragic $39,448 |
| Kiowa | 0.0 /100 | #329 | Tragic $39,232 |
| Immigrants | Congo | 0.0 /100 | #330 | Tragic $39,169 |
| Immigrants | Mexico | 0.0 /100 | #331 | Tragic $39,114 |
| Yakama | 0.0 /100 | #332 | Tragic $39,107 |
| Houma | 0.0 /100 | #333 | Tragic $38,949 |
| Spanish American Indians | 0.0 /100 | #334 | Tragic $38,907 |
| Natives/Alaskans | 0.0 /100 | #335 | Tragic $38,896 |
| Crow | 0.0 /100 | #336 | Tragic $38,707 |
| Immigrants | Cuba | 0.0 /100 | #337 | Tragic $38,426 |
| Pima | 0.0 /100 | #338 | Tragic $38,285 |
| Menominee | 0.0 /100 | #339 | Tragic $37,884 |
| Navajo | 0.0 /100 | #340 | Tragic $36,999 |
Demographics Similar to Chippewa by Median Earnings
In terms of median earnings, the demographic groups most similar to Chippewa are Hispanic or Latino ($40,288, a difference of 0.0%), Choctaw ($40,270, a difference of 0.040%), Cheyenne ($40,233, a difference of 0.13%), Seminole ($40,233, a difference of 0.13%), and Immigrants from Honduras ($40,195, a difference of 0.23%).
| Demographics | Rating | Rank | Median Earnings |
| Chickasaw | 0.0 /100 | #305 | Tragic $40,672 |
| Yaqui | 0.0 /100 | #306 | Tragic $40,647 |
| Hondurans | 0.0 /100 | #307 | Tragic $40,638 |
| Cubans | 0.0 /100 | #308 | Tragic $40,619 |
| Immigrants | Haiti | 0.0 /100 | #309 | Tragic $40,550 |
| Apache | 0.0 /100 | #310 | Tragic $40,388 |
| Hispanics or Latinos | 0.0 /100 | #311 | Tragic $40,288 |
| Chippewa | 0.0 /100 | #312 | Tragic $40,287 |
| Choctaw | 0.0 /100 | #313 | Tragic $40,270 |
| Cheyenne | 0.0 /100 | #314 | Tragic $40,233 |
| Seminole | 0.0 /100 | #315 | Tragic $40,233 |
| Immigrants | Honduras | 0.0 /100 | #316 | Tragic $40,195 |
| Fijians | 0.0 /100 | #317 | Tragic $40,193 |
| Dutch West Indians | 0.0 /100 | #318 | Tragic $40,107 |
| Blacks/African Americans | 0.0 /100 | #319 | Tragic $40,085 |