Houma vs Guatemalan Vision Disability
COMPARE
Houma
Guatemalan
Vision Disability
Vision Disability Comparison
Houma
Guatemalans
3.4%
VISION DISABILITY
0.0/ 100
METRIC RATING
346th/ 347
METRIC RANK
2.3%
VISION DISABILITY
0.5/ 100
METRIC RATING
247th/ 347
METRIC RANK
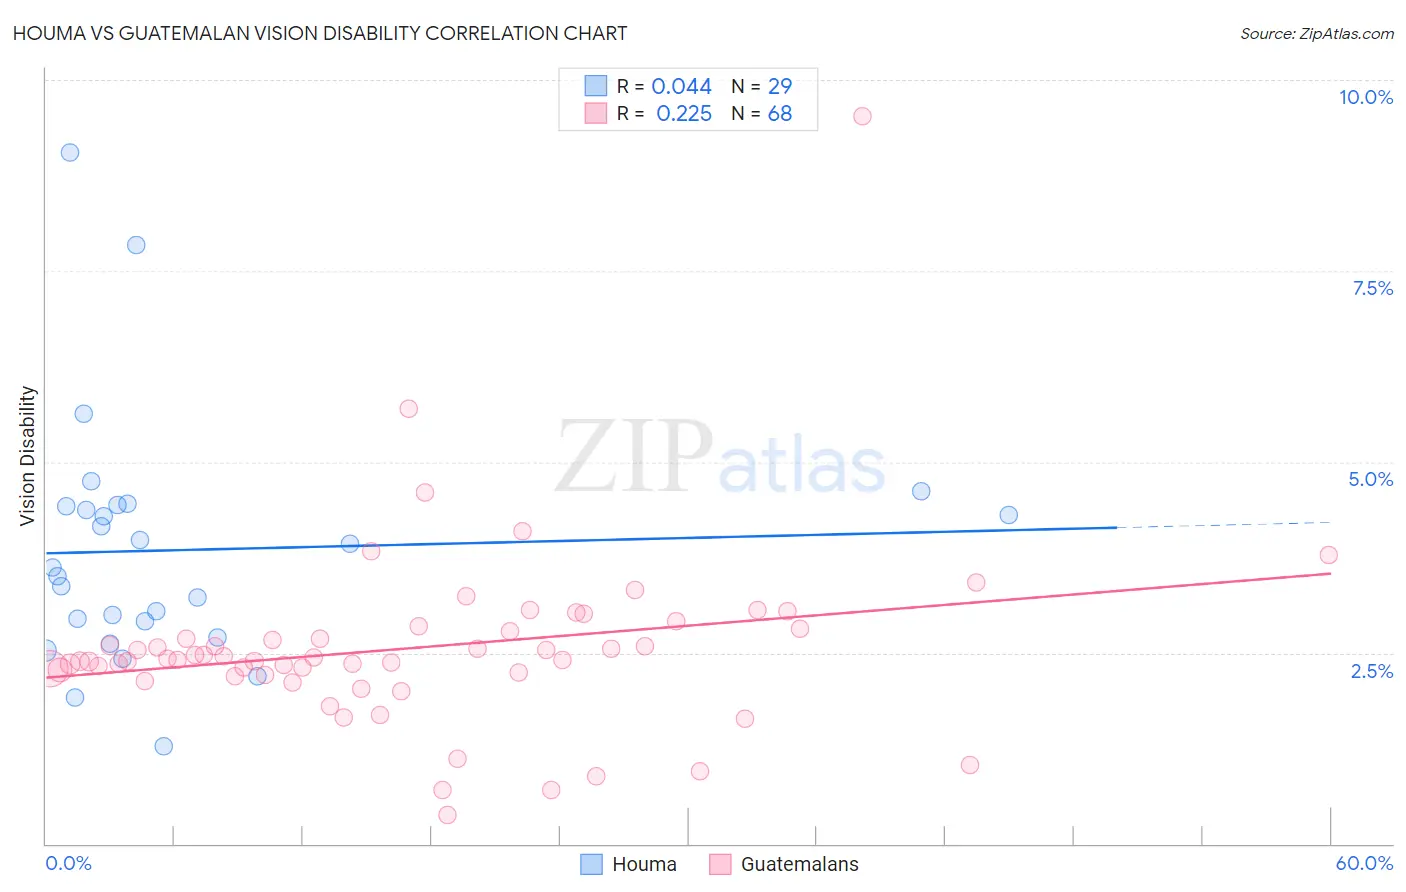
Houma vs Guatemalan Vision Disability Correlation Chart
The statistical analysis conducted on geographies consisting of 36,790,703 people shows no correlation between the proportion of Houma and percentage of population with vision disability in the United States with a correlation coefficient (R) of 0.044 and weighted average of 3.4%. Similarly, the statistical analysis conducted on geographies consisting of 409,275,877 people shows a weak positive correlation between the proportion of Guatemalans and percentage of population with vision disability in the United States with a correlation coefficient (R) of 0.225 and weighted average of 2.3%, a difference of 46.7%.
Vision Disability Correlation Summary
| Measurement | Houma | Guatemalan |
| Minimum | 1.3% | 0.37% |
| Maximum | 9.0% | 9.5% |
| Range | 7.8% | 9.2% |
| Mean | 3.8% | 2.6% |
| Median | 3.6% | 2.4% |
| Interquartile 25% (IQ1) | 2.8% | 2.2% |
| Interquartile 75% (IQ3) | 4.4% | 2.8% |
| Interquartile Range (IQR) | 1.6% | 0.57% |
| Standard Deviation (Sample) | 1.6% | 1.2% |
| Standard Deviation (Population) | 1.6% | 1.2% |
Similar Demographics by Vision Disability
Demographics Similar to Houma by Vision Disability
In terms of vision disability, the demographic groups most similar to Houma are Lumbee (3.4%, a difference of 1.7%), Pueblo (3.3%, a difference of 3.3%), Pima (3.3%, a difference of 3.3%), Choctaw (3.3%, a difference of 4.4%), and Kiowa (3.3%, a difference of 5.9%).
| Demographics | Rating | Rank | Vision Disability |
| Cajuns | 0.0 /100 | #333 | Tragic 3.1% |
| Cheyenne | 0.0 /100 | #334 | Tragic 3.1% |
| Navajo | 0.0 /100 | #335 | Tragic 3.1% |
| Alaskan Athabascans | 0.0 /100 | #336 | Tragic 3.1% |
| Dutch West Indians | 0.0 /100 | #337 | Tragic 3.2% |
| Chickasaw | 0.0 /100 | #338 | Tragic 3.2% |
| Tsimshian | 0.0 /100 | #339 | Tragic 3.2% |
| Creek | 0.0 /100 | #340 | Tragic 3.2% |
| Kiowa | 0.0 /100 | #341 | Tragic 3.3% |
| Choctaw | 0.0 /100 | #342 | Tragic 3.3% |
| Pima | 0.0 /100 | #343 | Tragic 3.3% |
| Pueblo | 0.0 /100 | #344 | Tragic 3.3% |
| Lumbee | 0.0 /100 | #345 | Tragic 3.4% |
| Houma | 0.0 /100 | #346 | Tragic 3.4% |
| Puerto Ricans | 0.0 /100 | #347 | Tragic 3.9% |
Demographics Similar to Guatemalans by Vision Disability
In terms of vision disability, the demographic groups most similar to Guatemalans are Subsaharan African (2.3%, a difference of 0.020%), Liberian (2.3%, a difference of 0.030%), French (2.3%, a difference of 0.040%), Bangladeshi (2.3%, a difference of 0.12%), and Alsatian (2.3%, a difference of 0.19%).
| Demographics | Rating | Rank | Vision Disability |
| Panamanians | 0.9 /100 | #240 | Tragic 2.3% |
| Malaysians | 0.9 /100 | #241 | Tragic 2.3% |
| Immigrants | Panama | 0.8 /100 | #242 | Tragic 2.3% |
| Immigrants | Nicaragua | 0.6 /100 | #243 | Tragic 2.3% |
| Immigrants | West Indies | 0.6 /100 | #244 | Tragic 2.3% |
| Alsatians | 0.6 /100 | #245 | Tragic 2.3% |
| French | 0.5 /100 | #246 | Tragic 2.3% |
| Guatemalans | 0.5 /100 | #247 | Tragic 2.3% |
| Sub-Saharan Africans | 0.5 /100 | #248 | Tragic 2.3% |
| Liberians | 0.5 /100 | #249 | Tragic 2.3% |
| Bangladeshis | 0.5 /100 | #250 | Tragic 2.3% |
| Immigrants | Laos | 0.4 /100 | #251 | Tragic 2.4% |
| Immigrants | Micronesia | 0.3 /100 | #252 | Tragic 2.4% |
| Japanese | 0.3 /100 | #253 | Tragic 2.4% |
| Haitians | 0.3 /100 | #254 | Tragic 2.4% |