Houma vs Shoshone Vision Disability
COMPARE
Houma
Shoshone
Vision Disability
Vision Disability Comparison
Houma
Shoshone
3.4%
VISION DISABILITY
0.0/ 100
METRIC RATING
346th/ 347
METRIC RANK
2.7%
VISION DISABILITY
0.0/ 100
METRIC RATING
316th/ 347
METRIC RANK
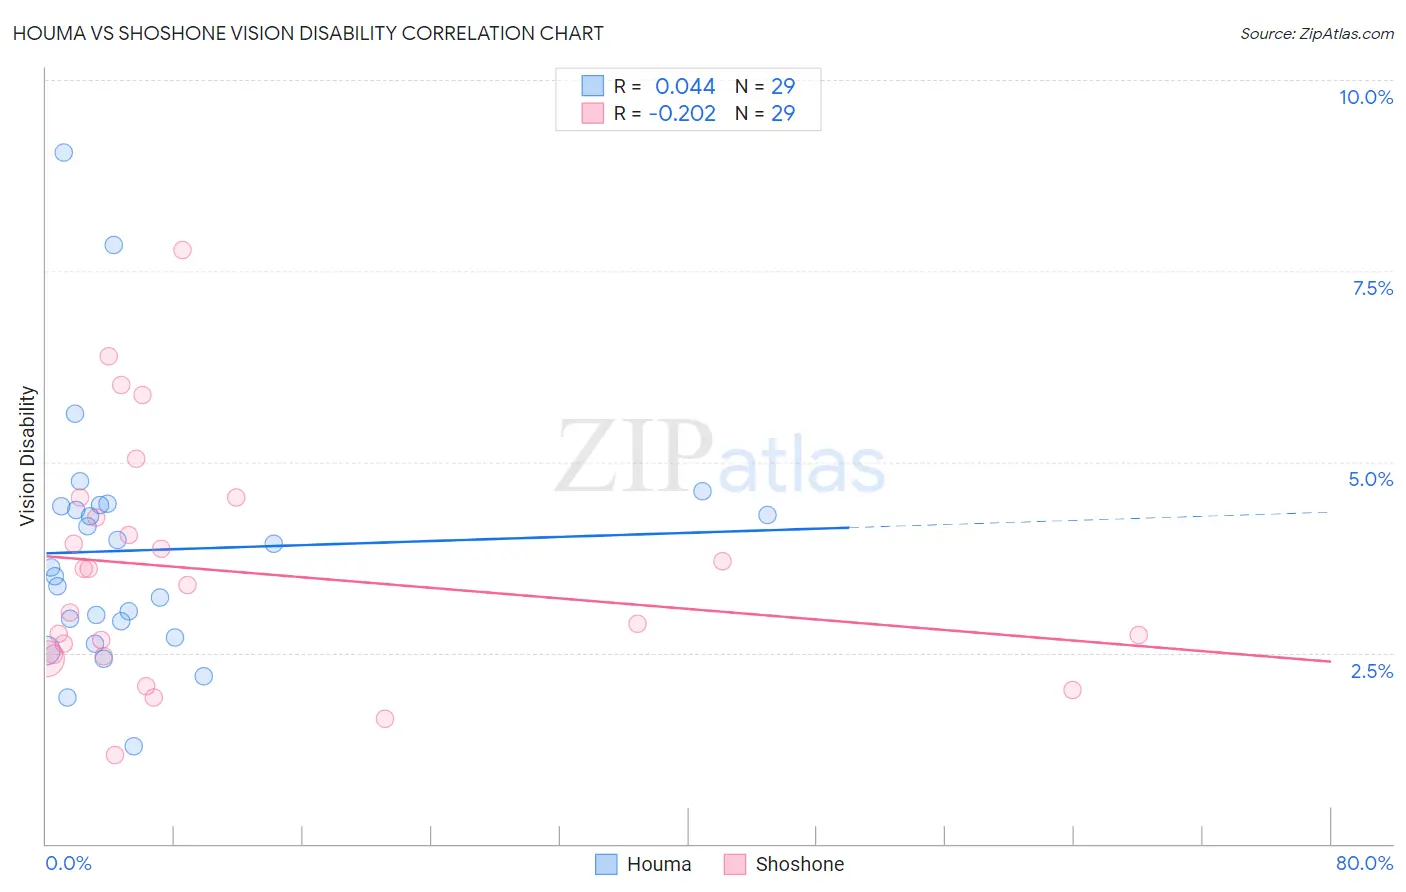
Houma vs Shoshone Vision Disability Correlation Chart
The statistical analysis conducted on geographies consisting of 36,790,703 people shows no correlation between the proportion of Houma and percentage of population with vision disability in the United States with a correlation coefficient (R) of 0.044 and weighted average of 3.4%. Similarly, the statistical analysis conducted on geographies consisting of 66,614,475 people shows a weak negative correlation between the proportion of Shoshone and percentage of population with vision disability in the United States with a correlation coefficient (R) of -0.202 and weighted average of 2.7%, a difference of 27.8%.
Vision Disability Correlation Summary
| Measurement | Houma | Shoshone |
| Minimum | 1.3% | 1.2% |
| Maximum | 9.0% | 7.8% |
| Range | 7.8% | 6.6% |
| Mean | 3.8% | 3.6% |
| Median | 3.6% | 3.4% |
| Interquartile 25% (IQ1) | 2.8% | 2.5% |
| Interquartile 75% (IQ3) | 4.4% | 4.4% |
| Interquartile Range (IQR) | 1.6% | 1.9% |
| Standard Deviation (Sample) | 1.6% | 1.5% |
| Standard Deviation (Population) | 1.6% | 1.5% |
Similar Demographics by Vision Disability
Demographics Similar to Houma by Vision Disability
In terms of vision disability, the demographic groups most similar to Houma are Lumbee (3.4%, a difference of 1.7%), Pueblo (3.3%, a difference of 3.3%), Pima (3.3%, a difference of 3.3%), Choctaw (3.3%, a difference of 4.4%), and Kiowa (3.3%, a difference of 5.9%).
| Demographics | Rating | Rank | Vision Disability |
| Cajuns | 0.0 /100 | #333 | Tragic 3.1% |
| Cheyenne | 0.0 /100 | #334 | Tragic 3.1% |
| Navajo | 0.0 /100 | #335 | Tragic 3.1% |
| Alaskan Athabascans | 0.0 /100 | #336 | Tragic 3.1% |
| Dutch West Indians | 0.0 /100 | #337 | Tragic 3.2% |
| Chickasaw | 0.0 /100 | #338 | Tragic 3.2% |
| Tsimshian | 0.0 /100 | #339 | Tragic 3.2% |
| Creek | 0.0 /100 | #340 | Tragic 3.2% |
| Kiowa | 0.0 /100 | #341 | Tragic 3.3% |
| Choctaw | 0.0 /100 | #342 | Tragic 3.3% |
| Pima | 0.0 /100 | #343 | Tragic 3.3% |
| Pueblo | 0.0 /100 | #344 | Tragic 3.3% |
| Lumbee | 0.0 /100 | #345 | Tragic 3.4% |
| Houma | 0.0 /100 | #346 | Tragic 3.4% |
| Puerto Ricans | 0.0 /100 | #347 | Tragic 3.9% |
Demographics Similar to Shoshone by Vision Disability
In terms of vision disability, the demographic groups most similar to Shoshone are Yup'ik (2.7%, a difference of 0.20%), Osage (2.7%, a difference of 0.43%), Alaska Native (2.7%, a difference of 1.3%), Inupiat (2.7%, a difference of 1.6%), and Potawatomi (2.6%, a difference of 1.7%).
| Demographics | Rating | Rank | Vision Disability |
| Immigrants | Yemen | 0.0 /100 | #309 | Tragic 2.6% |
| Blackfeet | 0.0 /100 | #310 | Tragic 2.6% |
| Dominicans | 0.0 /100 | #311 | Tragic 2.6% |
| Americans | 0.0 /100 | #312 | Tragic 2.6% |
| Potawatomi | 0.0 /100 | #313 | Tragic 2.6% |
| Inupiat | 0.0 /100 | #314 | Tragic 2.7% |
| Osage | 0.0 /100 | #315 | Tragic 2.7% |
| Shoshone | 0.0 /100 | #316 | Tragic 2.7% |
| Yup'ik | 0.0 /100 | #317 | Tragic 2.7% |
| Alaska Natives | 0.0 /100 | #318 | Tragic 2.7% |
| Tohono O'odham | 0.0 /100 | #319 | Tragic 2.8% |
| Blacks/African Americans | 0.0 /100 | #320 | Tragic 2.8% |
| Comanche | 0.0 /100 | #321 | Tragic 2.8% |
| Paiute | 0.0 /100 | #322 | Tragic 2.9% |
| Tlingit-Haida | 0.0 /100 | #323 | Tragic 2.9% |