Honduran vs Chippewa Vision Disability
COMPARE
Honduran
Chippewa
Vision Disability
Vision Disability Comparison
Hondurans
Chippewa
2.5%
VISION DISABILITY
0.0/ 100
METRIC RATING
287th/ 347
METRIC RANK
2.4%
VISION DISABILITY
0.0/ 100
METRIC RATING
275th/ 347
METRIC RANK
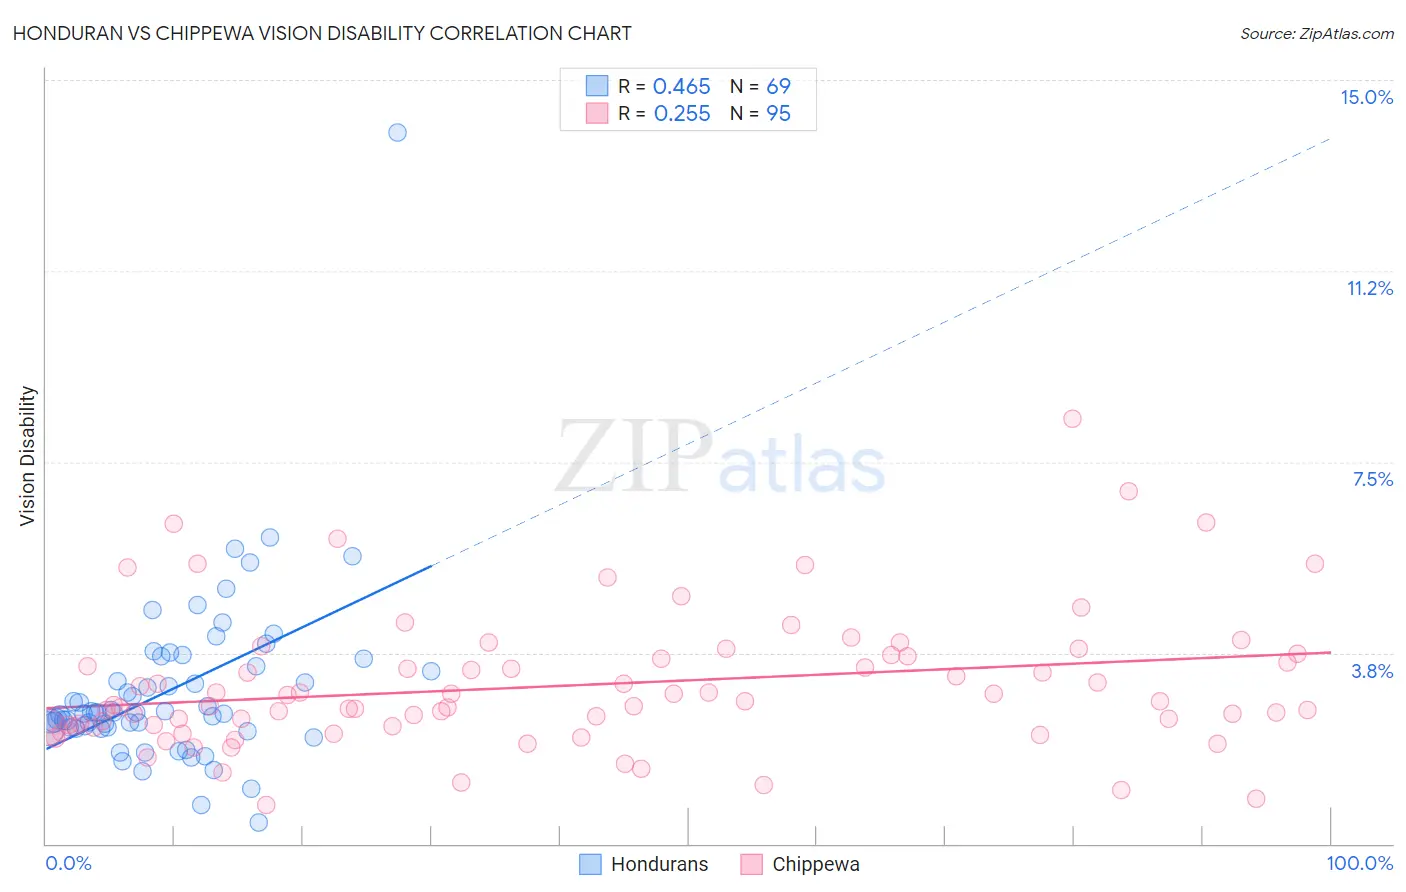
Honduran vs Chippewa Vision Disability Correlation Chart
The statistical analysis conducted on geographies consisting of 357,659,584 people shows a moderate positive correlation between the proportion of Hondurans and percentage of population with vision disability in the United States with a correlation coefficient (R) of 0.465 and weighted average of 2.5%. Similarly, the statistical analysis conducted on geographies consisting of 214,949,512 people shows a weak positive correlation between the proportion of Chippewa and percentage of population with vision disability in the United States with a correlation coefficient (R) of 0.255 and weighted average of 2.4%, a difference of 1.3%.
Vision Disability Correlation Summary
| Measurement | Honduran | Chippewa |
| Minimum | 0.42% | 0.77% |
| Maximum | 14.0% | 8.4% |
| Range | 13.5% | 7.6% |
| Mean | 3.0% | 3.1% |
| Median | 2.6% | 2.7% |
| Interquartile 25% (IQ1) | 2.3% | 2.3% |
| Interquartile 75% (IQ3) | 3.6% | 3.7% |
| Interquartile Range (IQR) | 1.3% | 1.4% |
| Standard Deviation (Sample) | 1.8% | 1.3% |
| Standard Deviation (Population) | 1.7% | 1.3% |
Demographics Similar to Hondurans and Chippewa by Vision Disability
In terms of vision disability, the demographic groups most similar to Hondurans are French American Indian (2.5%, a difference of 0.020%), Sioux (2.5%, a difference of 0.14%), Immigrants from Central America (2.5%, a difference of 0.15%), Yakama (2.5%, a difference of 0.17%), and Nonimmigrants (2.5%, a difference of 0.43%). Similarly, the demographic groups most similar to Chippewa are Scotch-Irish (2.4%, a difference of 0.090%), Bahamian (2.4%, a difference of 0.13%), Spanish (2.4%, a difference of 0.29%), Nepalese (2.4%, a difference of 0.30%), and Immigrants from Latin America (2.4%, a difference of 0.32%).
| Demographics | Rating | Rank | Vision Disability |
| Immigrants | Azores | 0.1 /100 | #271 | Tragic 2.4% |
| Spaniards | 0.1 /100 | #272 | Tragic 2.4% |
| Immigrants | Bahamas | 0.1 /100 | #273 | Tragic 2.4% |
| Immigrants | Latin America | 0.0 /100 | #274 | Tragic 2.4% |
| Chippewa | 0.0 /100 | #275 | Tragic 2.4% |
| Scotch-Irish | 0.0 /100 | #276 | Tragic 2.4% |
| Bahamians | 0.0 /100 | #277 | Tragic 2.4% |
| Spanish | 0.0 /100 | #278 | Tragic 2.4% |
| Nepalese | 0.0 /100 | #279 | Tragic 2.4% |
| Cape Verdeans | 0.0 /100 | #280 | Tragic 2.4% |
| U.S. Virgin Islanders | 0.0 /100 | #281 | Tragic 2.5% |
| Immigrants | Caribbean | 0.0 /100 | #282 | Tragic 2.5% |
| Puget Sound Salish | 0.0 /100 | #283 | Tragic 2.5% |
| Yakama | 0.0 /100 | #284 | Tragic 2.5% |
| Immigrants | Central America | 0.0 /100 | #285 | Tragic 2.5% |
| Sioux | 0.0 /100 | #286 | Tragic 2.5% |
| Hondurans | 0.0 /100 | #287 | Tragic 2.5% |
| French American Indians | 0.0 /100 | #288 | Tragic 2.5% |
| Immigrants | Nonimmigrants | 0.0 /100 | #289 | Tragic 2.5% |
| Immigrants | Cuba | 0.0 /100 | #290 | Tragic 2.5% |
| Immigrants | Honduras | 0.0 /100 | #291 | Tragic 2.5% |