Houma vs German Russian Vision Disability
COMPARE
Houma
German Russian
Vision Disability
Vision Disability Comparison
Houma
German Russians
3.4%
VISION DISABILITY
0.0/ 100
METRIC RATING
346th/ 347
METRIC RANK
2.3%
VISION DISABILITY
1.8/ 100
METRIC RATING
232nd/ 347
METRIC RANK
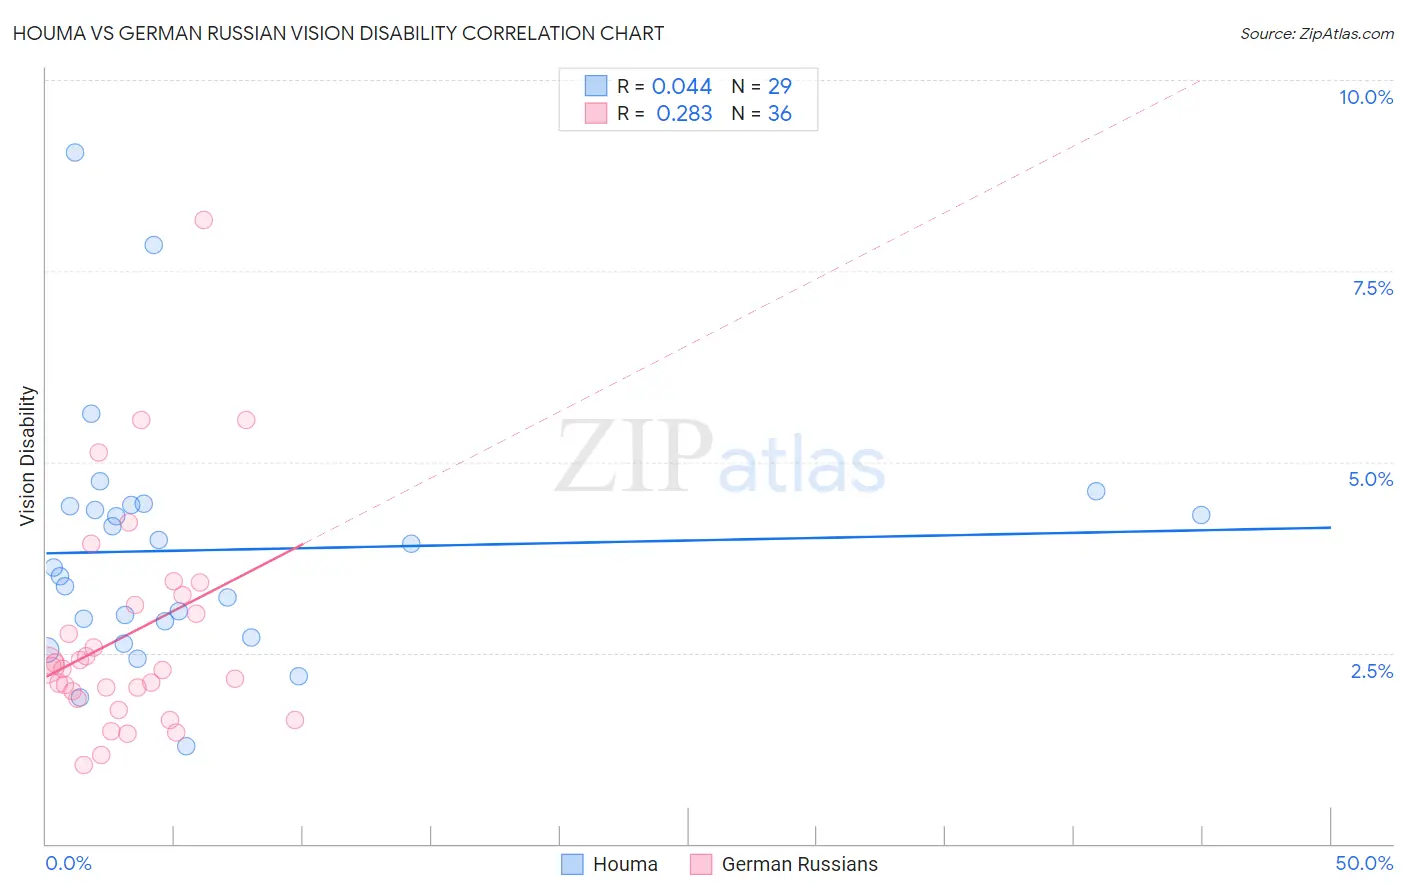
Houma vs German Russian Vision Disability Correlation Chart
The statistical analysis conducted on geographies consisting of 36,790,703 people shows no correlation between the proportion of Houma and percentage of population with vision disability in the United States with a correlation coefficient (R) of 0.044 and weighted average of 3.4%. Similarly, the statistical analysis conducted on geographies consisting of 96,448,558 people shows a weak positive correlation between the proportion of German Russians and percentage of population with vision disability in the United States with a correlation coefficient (R) of 0.283 and weighted average of 2.3%, a difference of 49.5%.
Vision Disability Correlation Summary
| Measurement | Houma | German Russian |
| Minimum | 1.3% | 1.0% |
| Maximum | 9.0% | 8.2% |
| Range | 7.8% | 7.1% |
| Mean | 3.8% | 2.7% |
| Median | 3.6% | 2.3% |
| Interquartile 25% (IQ1) | 2.8% | 1.9% |
| Interquartile 75% (IQ3) | 4.4% | 3.2% |
| Interquartile Range (IQR) | 1.6% | 1.2% |
| Standard Deviation (Sample) | 1.6% | 1.5% |
| Standard Deviation (Population) | 1.6% | 1.4% |
Similar Demographics by Vision Disability
Demographics Similar to Houma by Vision Disability
In terms of vision disability, the demographic groups most similar to Houma are Lumbee (3.4%, a difference of 1.7%), Pueblo (3.3%, a difference of 3.3%), Pima (3.3%, a difference of 3.3%), Choctaw (3.3%, a difference of 4.4%), and Kiowa (3.3%, a difference of 5.9%).
| Demographics | Rating | Rank | Vision Disability |
| Cajuns | 0.0 /100 | #333 | Tragic 3.1% |
| Cheyenne | 0.0 /100 | #334 | Tragic 3.1% |
| Navajo | 0.0 /100 | #335 | Tragic 3.1% |
| Alaskan Athabascans | 0.0 /100 | #336 | Tragic 3.1% |
| Dutch West Indians | 0.0 /100 | #337 | Tragic 3.2% |
| Chickasaw | 0.0 /100 | #338 | Tragic 3.2% |
| Tsimshian | 0.0 /100 | #339 | Tragic 3.2% |
| Creek | 0.0 /100 | #340 | Tragic 3.2% |
| Kiowa | 0.0 /100 | #341 | Tragic 3.3% |
| Choctaw | 0.0 /100 | #342 | Tragic 3.3% |
| Pima | 0.0 /100 | #343 | Tragic 3.3% |
| Pueblo | 0.0 /100 | #344 | Tragic 3.3% |
| Lumbee | 0.0 /100 | #345 | Tragic 3.4% |
| Houma | 0.0 /100 | #346 | Tragic 3.4% |
| Puerto Ricans | 0.0 /100 | #347 | Tragic 3.9% |
Demographics Similar to German Russians by Vision Disability
In terms of vision disability, the demographic groups most similar to German Russians are Central American (2.3%, a difference of 0.020%), Immigrants from Ecuador (2.3%, a difference of 0.19%), Scottish (2.3%, a difference of 0.20%), Marshallese (2.3%, a difference of 0.27%), and Nicaraguan (2.3%, a difference of 0.35%).
| Demographics | Rating | Rank | Vision Disability |
| Immigrants | Western Africa | 3.4 /100 | #225 | Tragic 2.3% |
| Immigrants | Germany | 3.0 /100 | #226 | Tragic 2.3% |
| Hawaiians | 2.9 /100 | #227 | Tragic 2.3% |
| Hmong | 2.5 /100 | #228 | Tragic 2.3% |
| Welsh | 2.3 /100 | #229 | Tragic 2.3% |
| Nicaraguans | 2.2 /100 | #230 | Tragic 2.3% |
| Immigrants | Ecuador | 2.0 /100 | #231 | Tragic 2.3% |
| German Russians | 1.8 /100 | #232 | Tragic 2.3% |
| Central Americans | 1.8 /100 | #233 | Tragic 2.3% |
| Scottish | 1.6 /100 | #234 | Tragic 2.3% |
| Marshallese | 1.5 /100 | #235 | Tragic 2.3% |
| Immigrants | Congo | 1.4 /100 | #236 | Tragic 2.3% |
| Immigrants | Portugal | 1.4 /100 | #237 | Tragic 2.3% |
| Immigrants | Cambodia | 1.1 /100 | #238 | Tragic 2.3% |
| English | 1.1 /100 | #239 | Tragic 2.3% |