Houma vs Jordanian Vision Disability
COMPARE
Houma
Jordanian
Vision Disability
Vision Disability Comparison
Houma
Jordanians
3.4%
VISION DISABILITY
0.0/ 100
METRIC RATING
346th/ 347
METRIC RANK
2.0%
VISION DISABILITY
99.2/ 100
METRIC RATING
56th/ 347
METRIC RANK
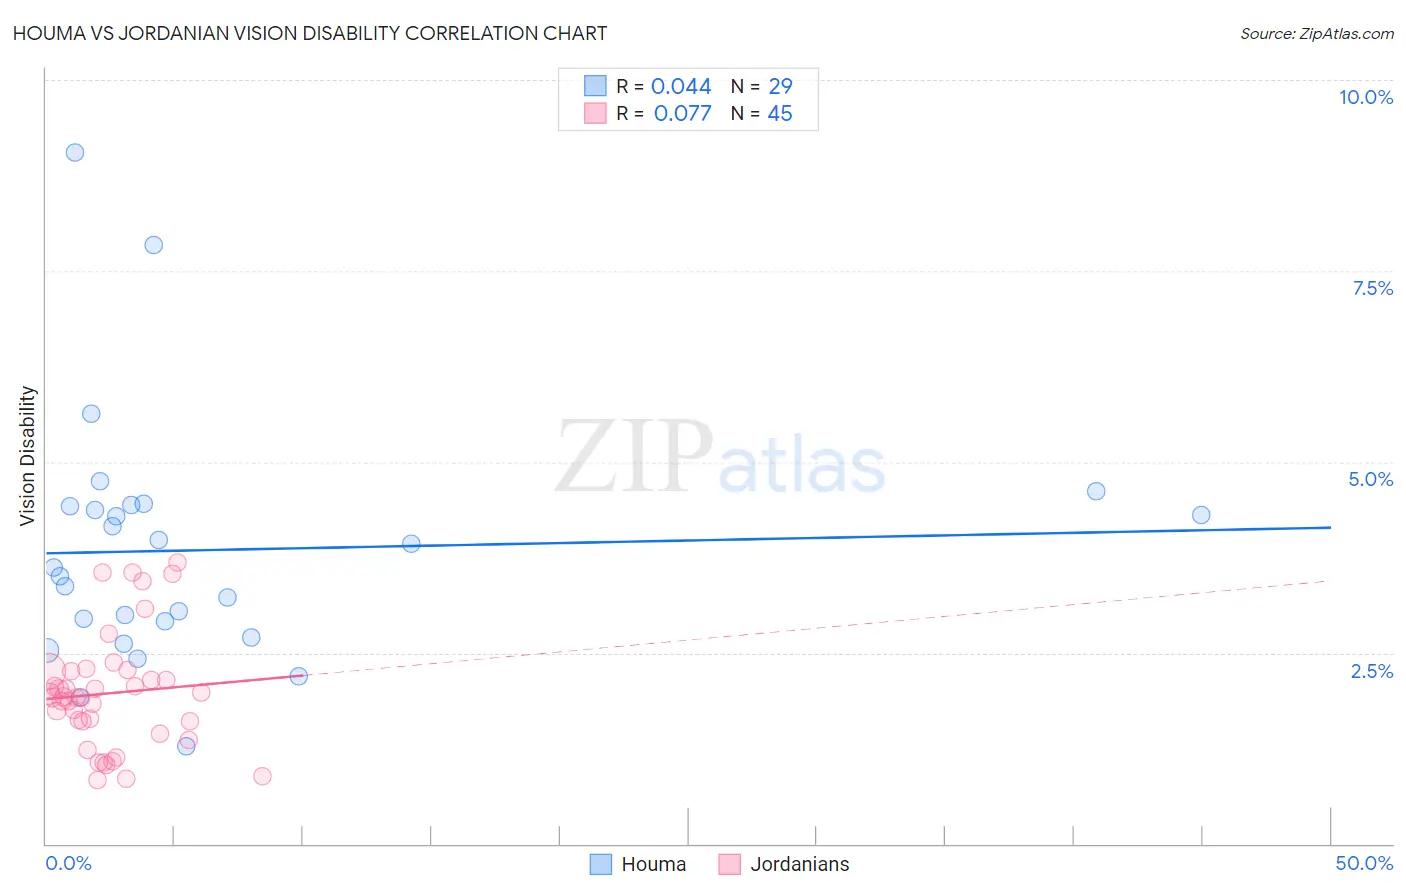
Houma vs Jordanian Vision Disability Correlation Chart
The statistical analysis conducted on geographies consisting of 36,790,703 people shows no correlation between the proportion of Houma and percentage of population with vision disability in the United States with a correlation coefficient (R) of 0.044 and weighted average of 3.4%. Similarly, the statistical analysis conducted on geographies consisting of 166,387,634 people shows a slight positive correlation between the proportion of Jordanians and percentage of population with vision disability in the United States with a correlation coefficient (R) of 0.077 and weighted average of 2.0%, a difference of 72.1%.
Vision Disability Correlation Summary
| Measurement | Houma | Jordanian |
| Minimum | 1.3% | 0.83% |
| Maximum | 9.0% | 3.7% |
| Range | 7.8% | 2.8% |
| Mean | 3.8% | 2.0% |
| Median | 3.6% | 1.9% |
| Interquartile 25% (IQ1) | 2.8% | 1.5% |
| Interquartile 75% (IQ3) | 4.4% | 2.3% |
| Interquartile Range (IQR) | 1.6% | 0.74% |
| Standard Deviation (Sample) | 1.6% | 0.75% |
| Standard Deviation (Population) | 1.6% | 0.74% |
Similar Demographics by Vision Disability
Demographics Similar to Houma by Vision Disability
In terms of vision disability, the demographic groups most similar to Houma are Lumbee (3.4%, a difference of 1.7%), Pueblo (3.3%, a difference of 3.3%), Pima (3.3%, a difference of 3.3%), Choctaw (3.3%, a difference of 4.4%), and Kiowa (3.3%, a difference of 5.9%).
| Demographics | Rating | Rank | Vision Disability |
| Cajuns | 0.0 /100 | #333 | Tragic 3.1% |
| Cheyenne | 0.0 /100 | #334 | Tragic 3.1% |
| Navajo | 0.0 /100 | #335 | Tragic 3.1% |
| Alaskan Athabascans | 0.0 /100 | #336 | Tragic 3.1% |
| Dutch West Indians | 0.0 /100 | #337 | Tragic 3.2% |
| Chickasaw | 0.0 /100 | #338 | Tragic 3.2% |
| Tsimshian | 0.0 /100 | #339 | Tragic 3.2% |
| Creek | 0.0 /100 | #340 | Tragic 3.2% |
| Kiowa | 0.0 /100 | #341 | Tragic 3.3% |
| Choctaw | 0.0 /100 | #342 | Tragic 3.3% |
| Pima | 0.0 /100 | #343 | Tragic 3.3% |
| Pueblo | 0.0 /100 | #344 | Tragic 3.3% |
| Lumbee | 0.0 /100 | #345 | Tragic 3.4% |
| Houma | 0.0 /100 | #346 | Tragic 3.4% |
| Puerto Ricans | 0.0 /100 | #347 | Tragic 3.9% |
Demographics Similar to Jordanians by Vision Disability
In terms of vision disability, the demographic groups most similar to Jordanians are Somali (2.0%, a difference of 0.020%), Immigrants from Saudi Arabia (2.0%, a difference of 0.090%), Laotian (2.0%, a difference of 0.17%), Macedonian (2.0%, a difference of 0.22%), and Argentinean (2.0%, a difference of 0.23%).
| Demographics | Rating | Rank | Vision Disability |
| Latvians | 99.5 /100 | #49 | Exceptional 2.0% |
| Afghans | 99.5 /100 | #50 | Exceptional 2.0% |
| Tongans | 99.5 /100 | #51 | Exceptional 2.0% |
| Immigrants | Serbia | 99.4 /100 | #52 | Exceptional 2.0% |
| Immigrants | Belarus | 99.3 /100 | #53 | Exceptional 2.0% |
| Macedonians | 99.3 /100 | #54 | Exceptional 2.0% |
| Laotians | 99.3 /100 | #55 | Exceptional 2.0% |
| Jordanians | 99.2 /100 | #56 | Exceptional 2.0% |
| Somalis | 99.2 /100 | #57 | Exceptional 2.0% |
| Immigrants | Saudi Arabia | 99.2 /100 | #58 | Exceptional 2.0% |
| Argentineans | 99.1 /100 | #59 | Exceptional 2.0% |
| Immigrants | Romania | 99.1 /100 | #60 | Exceptional 2.0% |
| Immigrants | Belgium | 99.1 /100 | #61 | Exceptional 2.0% |
| Immigrants | Russia | 99.1 /100 | #62 | Exceptional 2.0% |
| Armenians | 99.0 /100 | #63 | Exceptional 2.0% |