Houma vs Thai Vision Disability
COMPARE
Houma
Thai
Vision Disability
Vision Disability Comparison
Houma
Thais
3.4%
VISION DISABILITY
0.0/ 100
METRIC RATING
346th/ 347
METRIC RANK
1.7%
VISION DISABILITY
100.0/ 100
METRIC RATING
4th/ 347
METRIC RANK
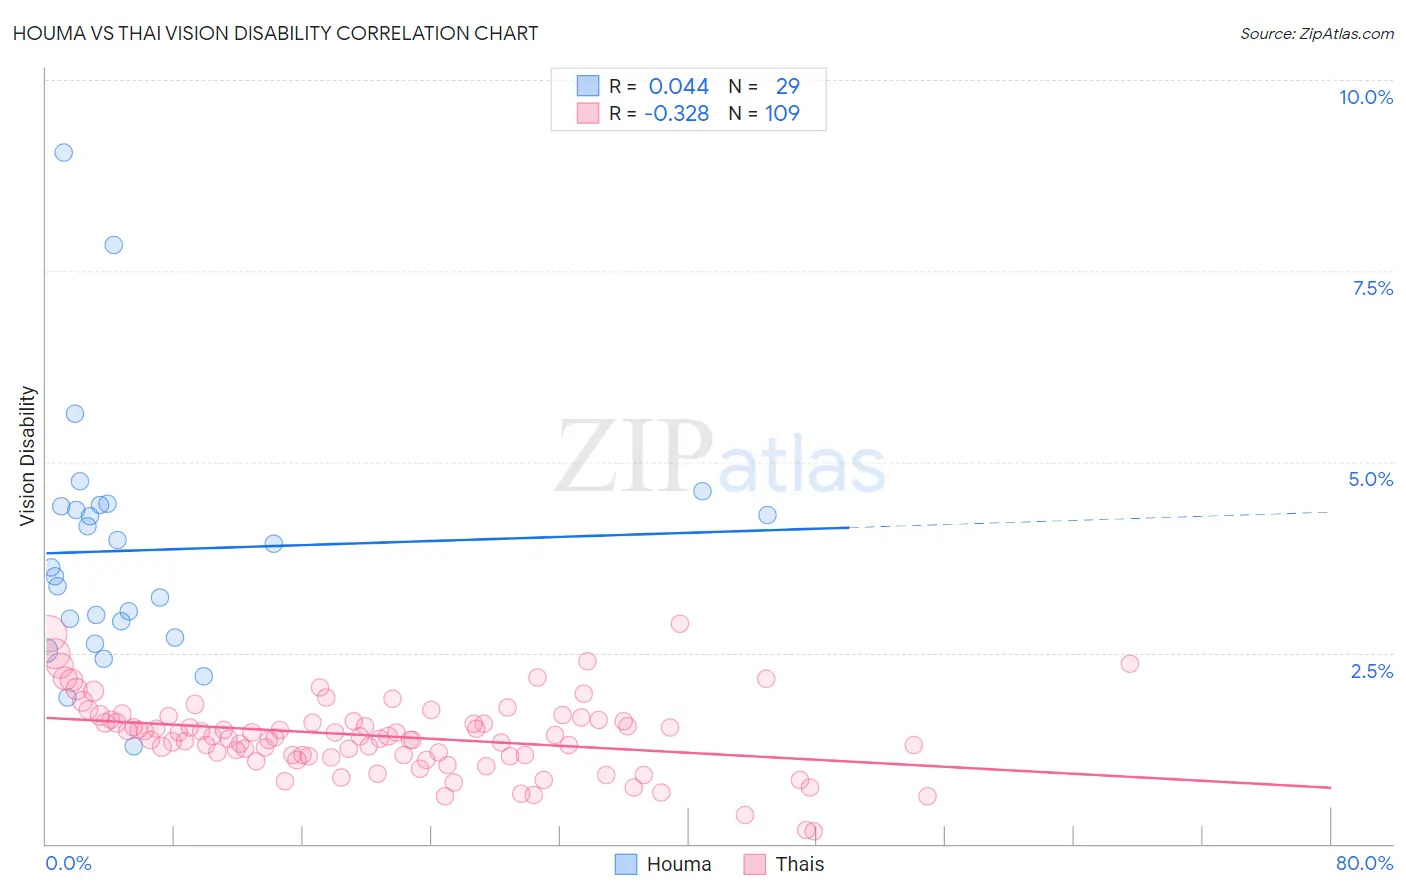
Houma vs Thai Vision Disability Correlation Chart
The statistical analysis conducted on geographies consisting of 36,790,703 people shows no correlation between the proportion of Houma and percentage of population with vision disability in the United States with a correlation coefficient (R) of 0.044 and weighted average of 3.4%. Similarly, the statistical analysis conducted on geographies consisting of 475,304,455 people shows a mild negative correlation between the proportion of Thais and percentage of population with vision disability in the United States with a correlation coefficient (R) of -0.328 and weighted average of 1.7%, a difference of 97.7%.
Vision Disability Correlation Summary
| Measurement | Houma | Thai |
| Minimum | 1.3% | 0.17% |
| Maximum | 9.0% | 2.9% |
| Range | 7.8% | 2.7% |
| Mean | 3.8% | 1.4% |
| Median | 3.6% | 1.4% |
| Interquartile 25% (IQ1) | 2.8% | 1.2% |
| Interquartile 75% (IQ3) | 4.4% | 1.6% |
| Interquartile Range (IQR) | 1.6% | 0.47% |
| Standard Deviation (Sample) | 1.6% | 0.49% |
| Standard Deviation (Population) | 1.6% | 0.48% |
Similar Demographics by Vision Disability
Demographics Similar to Houma by Vision Disability
In terms of vision disability, the demographic groups most similar to Houma are Lumbee (3.4%, a difference of 1.7%), Pueblo (3.3%, a difference of 3.3%), Pima (3.3%, a difference of 3.3%), Choctaw (3.3%, a difference of 4.4%), and Kiowa (3.3%, a difference of 5.9%).
| Demographics | Rating | Rank | Vision Disability |
| Cajuns | 0.0 /100 | #333 | Tragic 3.1% |
| Cheyenne | 0.0 /100 | #334 | Tragic 3.1% |
| Navajo | 0.0 /100 | #335 | Tragic 3.1% |
| Alaskan Athabascans | 0.0 /100 | #336 | Tragic 3.1% |
| Dutch West Indians | 0.0 /100 | #337 | Tragic 3.2% |
| Chickasaw | 0.0 /100 | #338 | Tragic 3.2% |
| Tsimshian | 0.0 /100 | #339 | Tragic 3.2% |
| Creek | 0.0 /100 | #340 | Tragic 3.2% |
| Kiowa | 0.0 /100 | #341 | Tragic 3.3% |
| Choctaw | 0.0 /100 | #342 | Tragic 3.3% |
| Pima | 0.0 /100 | #343 | Tragic 3.3% |
| Pueblo | 0.0 /100 | #344 | Tragic 3.3% |
| Lumbee | 0.0 /100 | #345 | Tragic 3.4% |
| Houma | 0.0 /100 | #346 | Tragic 3.4% |
| Puerto Ricans | 0.0 /100 | #347 | Tragic 3.9% |
Demographics Similar to Thais by Vision Disability
In terms of vision disability, the demographic groups most similar to Thais are Okinawan (1.8%, a difference of 1.9%), Immigrants from Iran (1.8%, a difference of 2.5%), Immigrants from South Central Asia (1.8%, a difference of 2.6%), Immigrants from Taiwan (1.7%, a difference of 2.6%), and Iranian (1.8%, a difference of 2.7%).
| Demographics | Rating | Rank | Vision Disability |
| Immigrants | India | 100.0 /100 | #1 | Exceptional 1.7% |
| Filipinos | 100.0 /100 | #2 | Exceptional 1.7% |
| Immigrants | Taiwan | 100.0 /100 | #3 | Exceptional 1.7% |
| Thais | 100.0 /100 | #4 | Exceptional 1.7% |
| Okinawans | 100.0 /100 | #5 | Exceptional 1.8% |
| Immigrants | Iran | 100.0 /100 | #6 | Exceptional 1.8% |
| Immigrants | South Central Asia | 100.0 /100 | #7 | Exceptional 1.8% |
| Iranians | 100.0 /100 | #8 | Exceptional 1.8% |
| Immigrants | Singapore | 100.0 /100 | #9 | Exceptional 1.8% |
| Immigrants | Hong Kong | 100.0 /100 | #10 | Exceptional 1.8% |
| Immigrants | Israel | 100.0 /100 | #11 | Exceptional 1.8% |
| Immigrants | Korea | 100.0 /100 | #12 | Exceptional 1.8% |
| Immigrants | Eastern Asia | 100.0 /100 | #13 | Exceptional 1.8% |
| Immigrants | China | 100.0 /100 | #14 | Exceptional 1.8% |
| Immigrants | Bolivia | 100.0 /100 | #15 | Exceptional 1.8% |