Finnish vs Australian Ambulatory Disability
COMPARE
Finnish
Australian
Ambulatory Disability
Ambulatory Disability Comparison
Finns
Australians
6.2%
AMBULATORY DISABILITY
17.2/ 100
METRIC RATING
206th/ 347
METRIC RANK
5.8%
AMBULATORY DISABILITY
98.8/ 100
METRIC RATING
90th/ 347
METRIC RANK
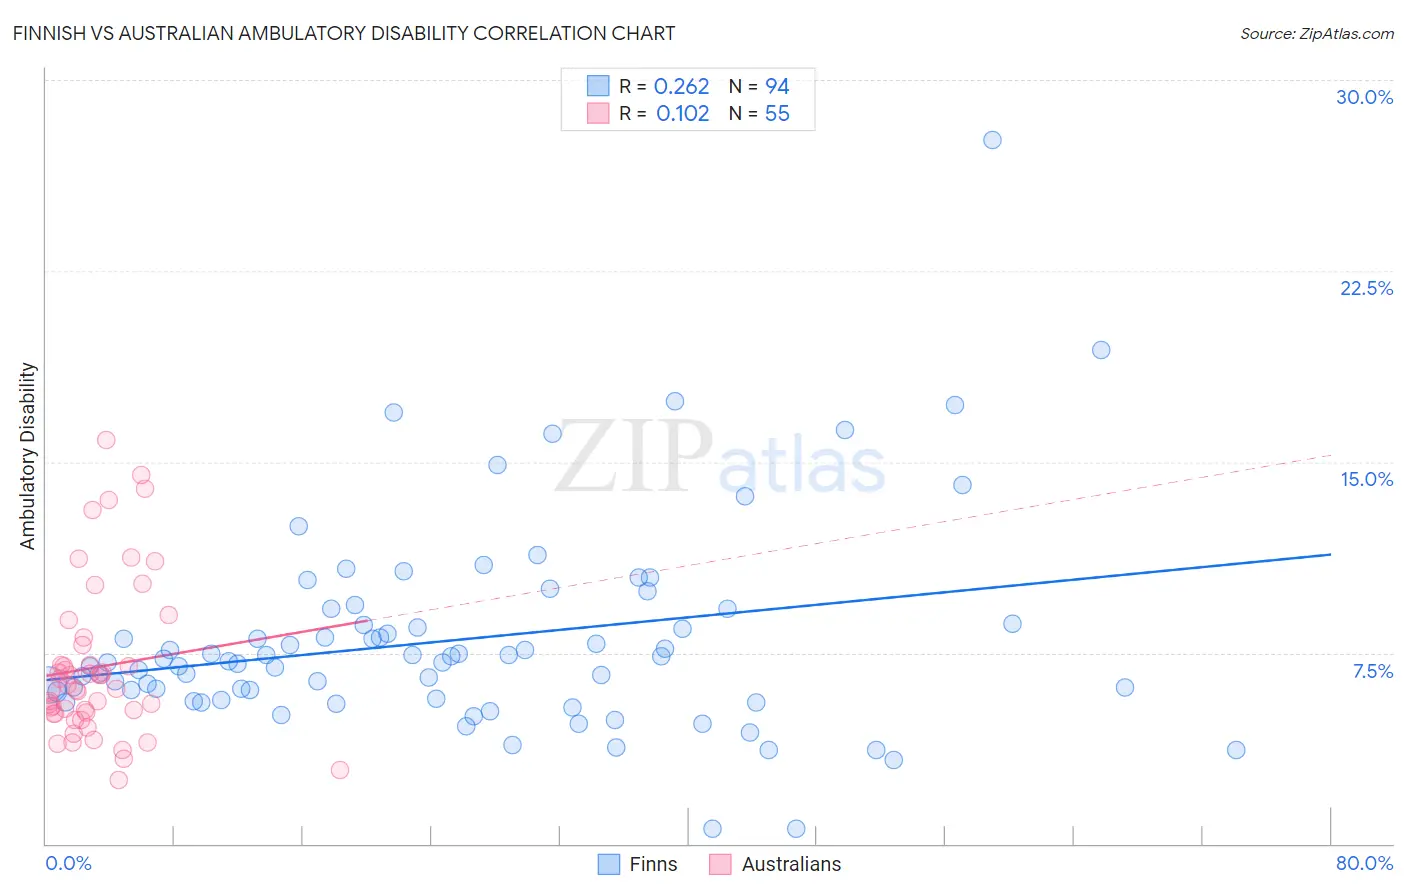
Finnish vs Australian Ambulatory Disability Correlation Chart
The statistical analysis conducted on geographies consisting of 404,562,886 people shows a weak positive correlation between the proportion of Finns and percentage of population with ambulatory disability in the United States with a correlation coefficient (R) of 0.262 and weighted average of 6.2%. Similarly, the statistical analysis conducted on geographies consisting of 224,102,055 people shows a poor positive correlation between the proportion of Australians and percentage of population with ambulatory disability in the United States with a correlation coefficient (R) of 0.102 and weighted average of 5.8%, a difference of 8.4%.
Ambulatory Disability Correlation Summary
| Measurement | Finnish | Australian |
| Minimum | 0.58% | 2.5% |
| Maximum | 27.6% | 15.8% |
| Range | 27.1% | 13.3% |
| Mean | 8.0% | 6.9% |
| Median | 7.2% | 6.1% |
| Interquartile 25% (IQ1) | 5.7% | 5.1% |
| Interquartile 75% (IQ3) | 8.6% | 7.8% |
| Interquartile Range (IQR) | 2.9% | 2.7% |
| Standard Deviation (Sample) | 4.0% | 3.0% |
| Standard Deviation (Population) | 4.0% | 3.0% |
Similar Demographics by Ambulatory Disability
Demographics Similar to Finns by Ambulatory Disability
In terms of ambulatory disability, the demographic groups most similar to Finns are Slovene (6.2%, a difference of 0.070%), Immigrants from Congo (6.2%, a difference of 0.090%), Immigrants from Ukraine (6.2%, a difference of 0.10%), Alsatian (6.3%, a difference of 0.21%), and Albanian (6.2%, a difference of 0.22%).
| Demographics | Rating | Rank | Ambulatory Disability |
| Italians | 22.6 /100 | #199 | Fair 6.2% |
| Immigrants | Cambodia | 21.5 /100 | #200 | Fair 6.2% |
| Immigrants | Central America | 20.1 /100 | #201 | Fair 6.2% |
| Albanians | 19.7 /100 | #202 | Poor 6.2% |
| Immigrants | Ukraine | 18.4 /100 | #203 | Poor 6.2% |
| Immigrants | Congo | 18.2 /100 | #204 | Poor 6.2% |
| Slovenes | 18.0 /100 | #205 | Poor 6.2% |
| Finns | 17.2 /100 | #206 | Poor 6.2% |
| Alsatians | 15.1 /100 | #207 | Poor 6.3% |
| Bangladeshis | 14.2 /100 | #208 | Poor 6.3% |
| Immigrants | Iraq | 14.0 /100 | #209 | Poor 6.3% |
| Immigrants | Laos | 13.2 /100 | #210 | Poor 6.3% |
| Samoans | 12.1 /100 | #211 | Poor 6.3% |
| Mexican American Indians | 12.0 /100 | #212 | Poor 6.3% |
| Japanese | 12.0 /100 | #213 | Poor 6.3% |
Demographics Similar to Australians by Ambulatory Disability
In terms of ambulatory disability, the demographic groups most similar to Australians are Bhutanese (5.8%, a difference of 0.0%), Immigrants from Sudan (5.8%, a difference of 0.0%), Soviet Union (5.8%, a difference of 0.12%), Immigrants from Chile (5.8%, a difference of 0.16%), and Immigrants from Sierra Leone (5.8%, a difference of 0.17%).
| Demographics | Rating | Rank | Ambulatory Disability |
| Eastern Europeans | 99.2 /100 | #83 | Exceptional 5.7% |
| Ugandans | 99.2 /100 | #84 | Exceptional 5.7% |
| South Americans | 99.0 /100 | #85 | Exceptional 5.7% |
| Latvians | 99.0 /100 | #86 | Exceptional 5.7% |
| Immigrants | Chile | 98.9 /100 | #87 | Exceptional 5.8% |
| Soviet Union | 98.9 /100 | #88 | Exceptional 5.8% |
| Bhutanese | 98.8 /100 | #89 | Exceptional 5.8% |
| Australians | 98.8 /100 | #90 | Exceptional 5.8% |
| Immigrants | Sudan | 98.8 /100 | #91 | Exceptional 5.8% |
| Immigrants | Sierra Leone | 98.6 /100 | #92 | Exceptional 5.8% |
| Immigrants | Denmark | 98.6 /100 | #93 | Exceptional 5.8% |
| Kenyans | 98.4 /100 | #94 | Exceptional 5.8% |
| Immigrants | El Salvador | 98.4 /100 | #95 | Exceptional 5.8% |
| Salvadorans | 98.4 /100 | #96 | Exceptional 5.8% |
| Immigrants | Somalia | 98.3 /100 | #97 | Exceptional 5.8% |