Finnish vs Apache Ambulatory Disability
COMPARE
Finnish
Apache
Ambulatory Disability
Ambulatory Disability Comparison
Finns
Apache
6.2%
AMBULATORY DISABILITY
17.2/ 100
METRIC RATING
206th/ 347
METRIC RANK
7.4%
AMBULATORY DISABILITY
0.0/ 100
METRIC RATING
321st/ 347
METRIC RANK
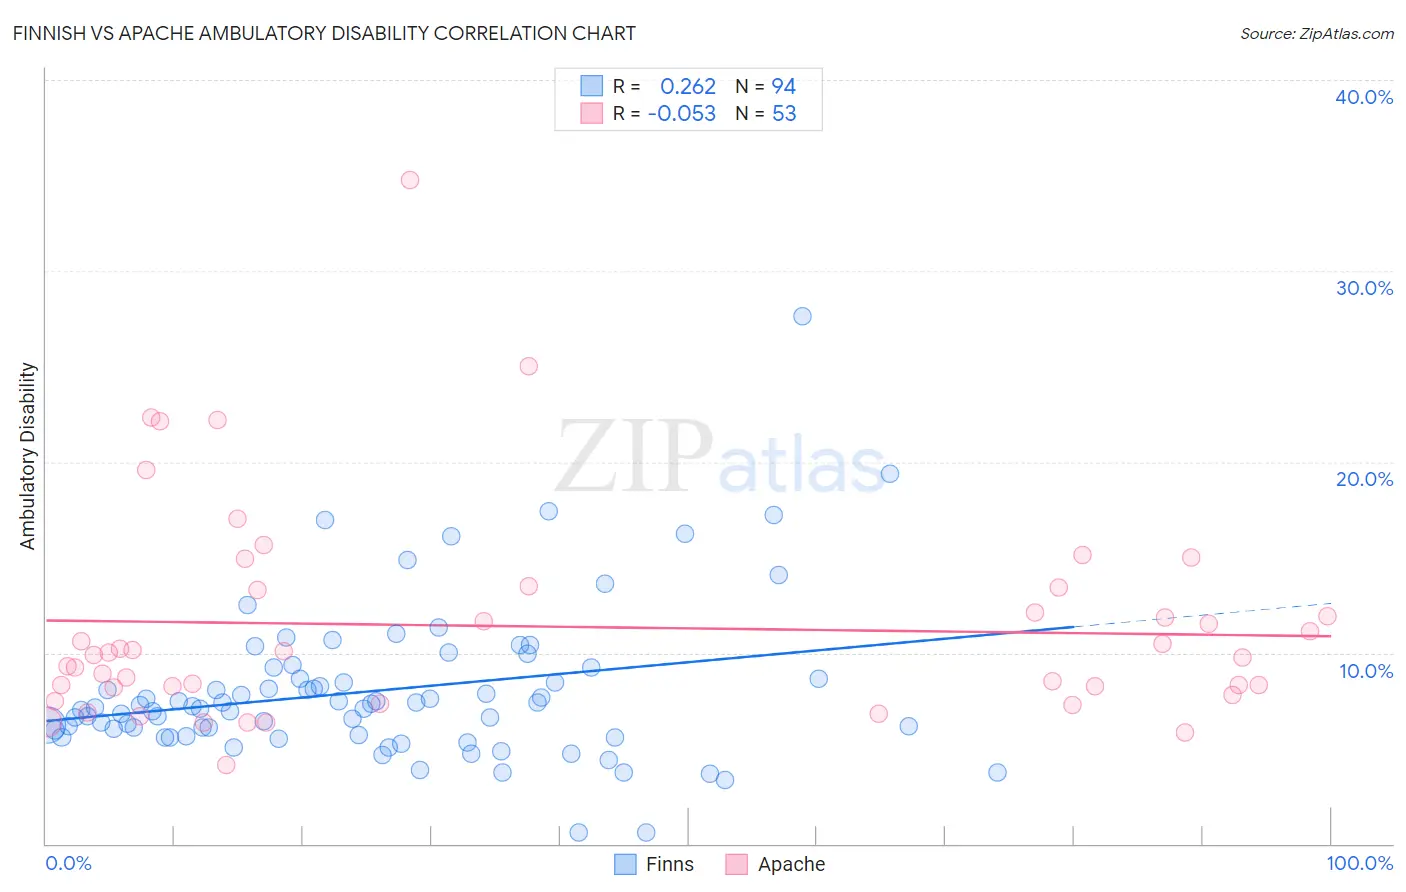
Finnish vs Apache Ambulatory Disability Correlation Chart
The statistical analysis conducted on geographies consisting of 404,562,886 people shows a weak positive correlation between the proportion of Finns and percentage of population with ambulatory disability in the United States with a correlation coefficient (R) of 0.262 and weighted average of 6.2%. Similarly, the statistical analysis conducted on geographies consisting of 231,047,475 people shows a slight negative correlation between the proportion of Apache and percentage of population with ambulatory disability in the United States with a correlation coefficient (R) of -0.053 and weighted average of 7.4%, a difference of 18.1%.
Ambulatory Disability Correlation Summary
| Measurement | Finnish | Apache |
| Minimum | 0.58% | 4.1% |
| Maximum | 27.6% | 34.8% |
| Range | 27.1% | 30.7% |
| Mean | 8.0% | 11.4% |
| Median | 7.2% | 9.9% |
| Interquartile 25% (IQ1) | 5.7% | 8.0% |
| Interquartile 75% (IQ3) | 8.6% | 13.4% |
| Interquartile Range (IQR) | 2.9% | 5.4% |
| Standard Deviation (Sample) | 4.0% | 5.7% |
| Standard Deviation (Population) | 4.0% | 5.6% |
Similar Demographics by Ambulatory Disability
Demographics Similar to Finns by Ambulatory Disability
In terms of ambulatory disability, the demographic groups most similar to Finns are Slovene (6.2%, a difference of 0.070%), Immigrants from Congo (6.2%, a difference of 0.090%), Immigrants from Ukraine (6.2%, a difference of 0.10%), Alsatian (6.3%, a difference of 0.21%), and Albanian (6.2%, a difference of 0.22%).
| Demographics | Rating | Rank | Ambulatory Disability |
| Italians | 22.6 /100 | #199 | Fair 6.2% |
| Immigrants | Cambodia | 21.5 /100 | #200 | Fair 6.2% |
| Immigrants | Central America | 20.1 /100 | #201 | Fair 6.2% |
| Albanians | 19.7 /100 | #202 | Poor 6.2% |
| Immigrants | Ukraine | 18.4 /100 | #203 | Poor 6.2% |
| Immigrants | Congo | 18.2 /100 | #204 | Poor 6.2% |
| Slovenes | 18.0 /100 | #205 | Poor 6.2% |
| Finns | 17.2 /100 | #206 | Poor 6.2% |
| Alsatians | 15.1 /100 | #207 | Poor 6.3% |
| Bangladeshis | 14.2 /100 | #208 | Poor 6.3% |
| Immigrants | Iraq | 14.0 /100 | #209 | Poor 6.3% |
| Immigrants | Laos | 13.2 /100 | #210 | Poor 6.3% |
| Samoans | 12.1 /100 | #211 | Poor 6.3% |
| Mexican American Indians | 12.0 /100 | #212 | Poor 6.3% |
| Japanese | 12.0 /100 | #213 | Poor 6.3% |
Demographics Similar to Apache by Ambulatory Disability
In terms of ambulatory disability, the demographic groups most similar to Apache are Osage (7.4%, a difference of 0.14%), American (7.4%, a difference of 0.42%), Potawatomi (7.3%, a difference of 0.81%), Navajo (7.5%, a difference of 1.7%), and Comanche (7.5%, a difference of 1.8%).
| Demographics | Rating | Rank | Ambulatory Disability |
| Blackfeet | 0.0 /100 | #314 | Tragic 7.1% |
| Shoshone | 0.0 /100 | #315 | Tragic 7.1% |
| Immigrants | Dominican Republic | 0.0 /100 | #316 | Tragic 7.1% |
| Central American Indians | 0.0 /100 | #317 | Tragic 7.2% |
| Ottawa | 0.0 /100 | #318 | Tragic 7.2% |
| Dominicans | 0.0 /100 | #319 | Tragic 7.2% |
| Potawatomi | 0.0 /100 | #320 | Tragic 7.3% |
| Apache | 0.0 /100 | #321 | Tragic 7.4% |
| Osage | 0.0 /100 | #322 | Tragic 7.4% |
| Americans | 0.0 /100 | #323 | Tragic 7.4% |
| Navajo | 0.0 /100 | #324 | Tragic 7.5% |
| Comanche | 0.0 /100 | #325 | Tragic 7.5% |
| Blacks/African Americans | 0.0 /100 | #326 | Tragic 7.5% |
| Natives/Alaskans | 0.0 /100 | #327 | Tragic 7.5% |
| Hopi | 0.0 /100 | #328 | Tragic 7.6% |