Finnish vs Immigrants from Micronesia Ambulatory Disability
COMPARE
Finnish
Immigrants from Micronesia
Ambulatory Disability
Ambulatory Disability Comparison
Finns
Immigrants from Micronesia
6.2%
AMBULATORY DISABILITY
17.2/ 100
METRIC RATING
206th/ 347
METRIC RANK
7.0%
AMBULATORY DISABILITY
0.0/ 100
METRIC RATING
305th/ 347
METRIC RANK
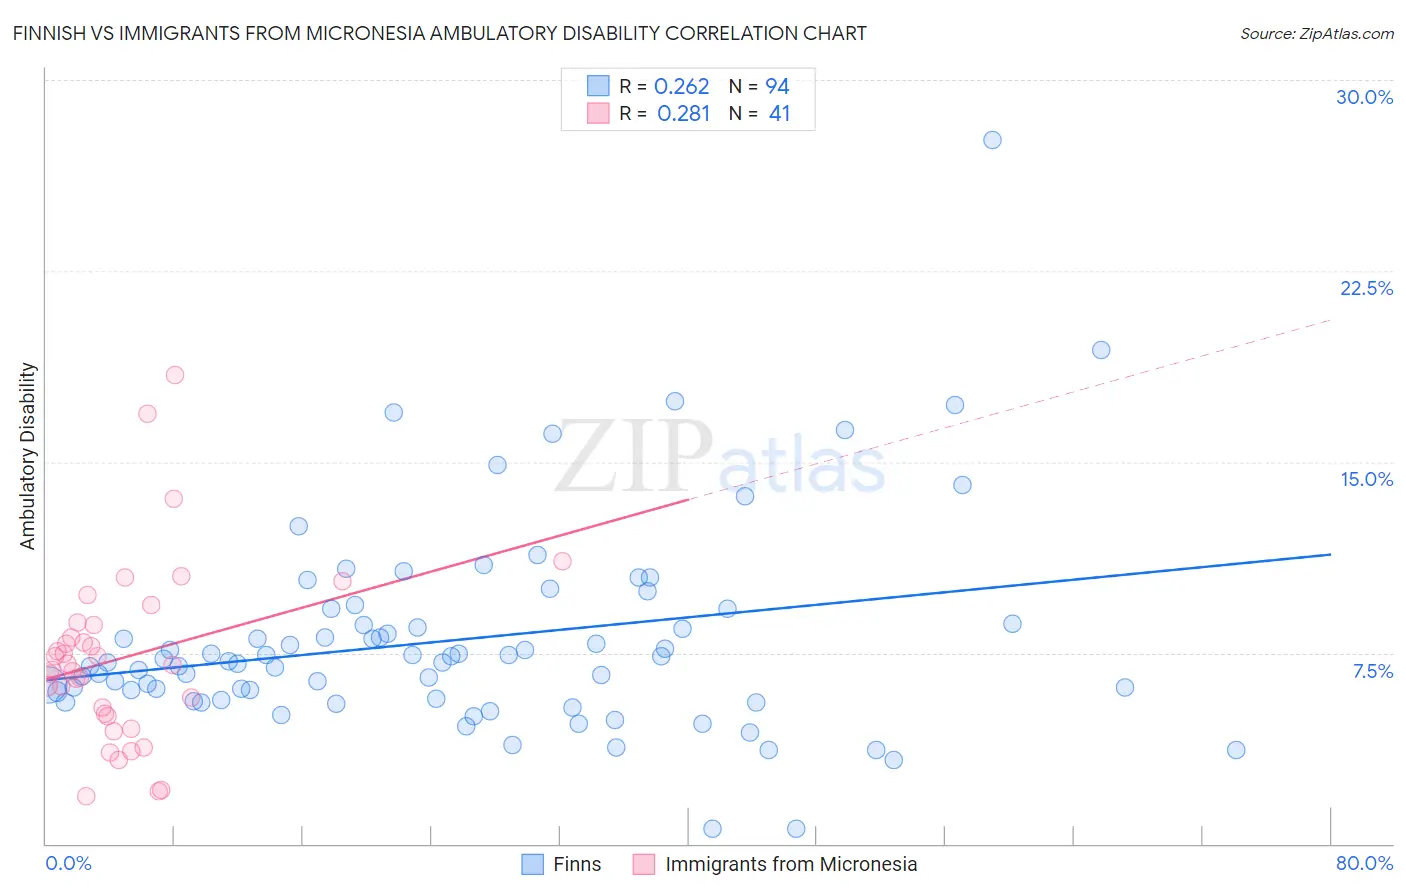
Finnish vs Immigrants from Micronesia Ambulatory Disability Correlation Chart
The statistical analysis conducted on geographies consisting of 404,562,886 people shows a weak positive correlation between the proportion of Finns and percentage of population with ambulatory disability in the United States with a correlation coefficient (R) of 0.262 and weighted average of 6.2%. Similarly, the statistical analysis conducted on geographies consisting of 61,585,357 people shows a weak positive correlation between the proportion of Immigrants from Micronesia and percentage of population with ambulatory disability in the United States with a correlation coefficient (R) of 0.281 and weighted average of 7.0%, a difference of 12.3%.
Ambulatory Disability Correlation Summary
| Measurement | Finnish | Immigrants from Micronesia |
| Minimum | 0.58% | 1.8% |
| Maximum | 27.6% | 18.4% |
| Range | 27.1% | 16.6% |
| Mean | 8.0% | 7.3% |
| Median | 7.2% | 7.0% |
| Interquartile 25% (IQ1) | 5.7% | 5.0% |
| Interquartile 75% (IQ3) | 8.6% | 8.6% |
| Interquartile Range (IQR) | 2.9% | 3.6% |
| Standard Deviation (Sample) | 4.0% | 3.5% |
| Standard Deviation (Population) | 4.0% | 3.5% |
Similar Demographics by Ambulatory Disability
Demographics Similar to Finns by Ambulatory Disability
In terms of ambulatory disability, the demographic groups most similar to Finns are Slovene (6.2%, a difference of 0.070%), Immigrants from Congo (6.2%, a difference of 0.090%), Immigrants from Ukraine (6.2%, a difference of 0.10%), Alsatian (6.3%, a difference of 0.21%), and Albanian (6.2%, a difference of 0.22%).
| Demographics | Rating | Rank | Ambulatory Disability |
| Italians | 22.6 /100 | #199 | Fair 6.2% |
| Immigrants | Cambodia | 21.5 /100 | #200 | Fair 6.2% |
| Immigrants | Central America | 20.1 /100 | #201 | Fair 6.2% |
| Albanians | 19.7 /100 | #202 | Poor 6.2% |
| Immigrants | Ukraine | 18.4 /100 | #203 | Poor 6.2% |
| Immigrants | Congo | 18.2 /100 | #204 | Poor 6.2% |
| Slovenes | 18.0 /100 | #205 | Poor 6.2% |
| Finns | 17.2 /100 | #206 | Poor 6.2% |
| Alsatians | 15.1 /100 | #207 | Poor 6.3% |
| Bangladeshis | 14.2 /100 | #208 | Poor 6.3% |
| Immigrants | Iraq | 14.0 /100 | #209 | Poor 6.3% |
| Immigrants | Laos | 13.2 /100 | #210 | Poor 6.3% |
| Samoans | 12.1 /100 | #211 | Poor 6.3% |
| Mexican American Indians | 12.0 /100 | #212 | Poor 6.3% |
| Japanese | 12.0 /100 | #213 | Poor 6.3% |
Demographics Similar to Immigrants from Micronesia by Ambulatory Disability
In terms of ambulatory disability, the demographic groups most similar to Immigrants from Micronesia are Immigrants from Cabo Verde (7.0%, a difference of 0.29%), Iroquois (7.1%, a difference of 0.53%), African (7.0%, a difference of 0.64%), Immigrants from Armenia (7.0%, a difference of 0.70%), and British West Indian (7.0%, a difference of 0.76%).
| Demographics | Rating | Rank | Ambulatory Disability |
| Immigrants | Grenada | 0.0 /100 | #298 | Tragic 6.9% |
| Puget Sound Salish | 0.0 /100 | #299 | Tragic 6.9% |
| Marshallese | 0.0 /100 | #300 | Tragic 6.9% |
| British West Indians | 0.0 /100 | #301 | Tragic 7.0% |
| Immigrants | Armenia | 0.0 /100 | #302 | Tragic 7.0% |
| Africans | 0.0 /100 | #303 | Tragic 7.0% |
| Immigrants | Cabo Verde | 0.0 /100 | #304 | Tragic 7.0% |
| Immigrants | Micronesia | 0.0 /100 | #305 | Tragic 7.0% |
| Iroquois | 0.0 /100 | #306 | Tragic 7.1% |
| Spanish Americans | 0.0 /100 | #307 | Tragic 7.1% |
| Chippewa | 0.0 /100 | #308 | Tragic 7.1% |
| Immigrants | Azores | 0.0 /100 | #309 | Tragic 7.1% |
| Arapaho | 0.0 /100 | #310 | Tragic 7.1% |
| Cree | 0.0 /100 | #311 | Tragic 7.1% |
| Delaware | 0.0 /100 | #312 | Tragic 7.1% |