Hmong vs Australian Ambulatory Disability
COMPARE
Hmong
Australian
Ambulatory Disability
Ambulatory Disability Comparison
Hmong
Australians
6.6%
AMBULATORY DISABILITY
0.3/ 100
METRIC RATING
263rd/ 347
METRIC RANK
5.8%
AMBULATORY DISABILITY
98.8/ 100
METRIC RATING
90th/ 347
METRIC RANK
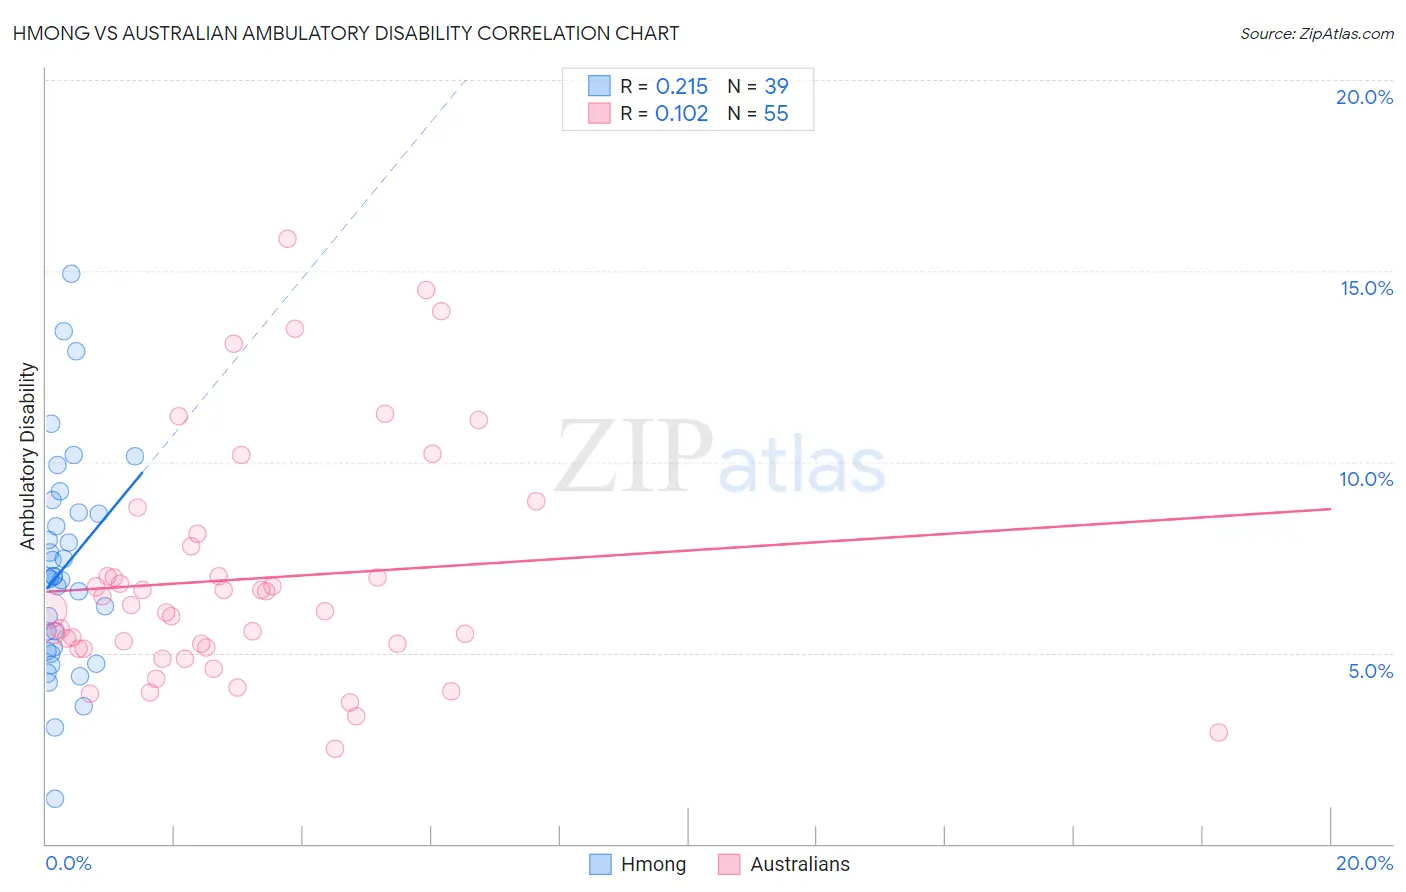
Hmong vs Australian Ambulatory Disability Correlation Chart
The statistical analysis conducted on geographies consisting of 24,680,511 people shows a weak positive correlation between the proportion of Hmong and percentage of population with ambulatory disability in the United States with a correlation coefficient (R) of 0.215 and weighted average of 6.6%. Similarly, the statistical analysis conducted on geographies consisting of 224,102,055 people shows a poor positive correlation between the proportion of Australians and percentage of population with ambulatory disability in the United States with a correlation coefficient (R) of 0.102 and weighted average of 5.8%, a difference of 14.2%.
Ambulatory Disability Correlation Summary
| Measurement | Hmong | Australian |
| Minimum | 1.2% | 2.5% |
| Maximum | 14.9% | 15.8% |
| Range | 13.7% | 13.3% |
| Mean | 7.2% | 6.9% |
| Median | 7.0% | 6.1% |
| Interquartile 25% (IQ1) | 5.0% | 5.1% |
| Interquartile 75% (IQ3) | 8.7% | 7.8% |
| Interquartile Range (IQR) | 3.7% | 2.7% |
| Standard Deviation (Sample) | 2.9% | 3.0% |
| Standard Deviation (Population) | 2.8% | 3.0% |
Similar Demographics by Ambulatory Disability
Demographics Similar to Hmong by Ambulatory Disability
In terms of ambulatory disability, the demographic groups most similar to Hmong are English (6.6%, a difference of 0.12%), Irish (6.6%, a difference of 0.29%), Immigrants from Belize (6.6%, a difference of 0.36%), Aleut (6.6%, a difference of 0.37%), and Nepalese (6.6%, a difference of 0.40%).
| Demographics | Rating | Rank | Ambulatory Disability |
| Immigrants | Uzbekistan | 0.6 /100 | #256 | Tragic 6.5% |
| Bermudans | 0.5 /100 | #257 | Tragic 6.5% |
| Spanish American Indians | 0.5 /100 | #258 | Tragic 6.5% |
| Aleuts | 0.4 /100 | #259 | Tragic 6.6% |
| Immigrants | Belize | 0.4 /100 | #260 | Tragic 6.6% |
| Irish | 0.4 /100 | #261 | Tragic 6.6% |
| English | 0.4 /100 | #262 | Tragic 6.6% |
| Hmong | 0.3 /100 | #263 | Tragic 6.6% |
| Nepalese | 0.2 /100 | #264 | Tragic 6.6% |
| Bahamians | 0.2 /100 | #265 | Tragic 6.6% |
| Guyanese | 0.2 /100 | #266 | Tragic 6.6% |
| Trinidadians and Tobagonians | 0.2 /100 | #267 | Tragic 6.6% |
| Spanish | 0.2 /100 | #268 | Tragic 6.6% |
| French | 0.1 /100 | #269 | Tragic 6.6% |
| Slovaks | 0.1 /100 | #270 | Tragic 6.7% |
Demographics Similar to Australians by Ambulatory Disability
In terms of ambulatory disability, the demographic groups most similar to Australians are Bhutanese (5.8%, a difference of 0.0%), Immigrants from Sudan (5.8%, a difference of 0.0%), Soviet Union (5.8%, a difference of 0.12%), Immigrants from Chile (5.8%, a difference of 0.16%), and Immigrants from Sierra Leone (5.8%, a difference of 0.17%).
| Demographics | Rating | Rank | Ambulatory Disability |
| Eastern Europeans | 99.2 /100 | #83 | Exceptional 5.7% |
| Ugandans | 99.2 /100 | #84 | Exceptional 5.7% |
| South Americans | 99.0 /100 | #85 | Exceptional 5.7% |
| Latvians | 99.0 /100 | #86 | Exceptional 5.7% |
| Immigrants | Chile | 98.9 /100 | #87 | Exceptional 5.8% |
| Soviet Union | 98.9 /100 | #88 | Exceptional 5.8% |
| Bhutanese | 98.8 /100 | #89 | Exceptional 5.8% |
| Australians | 98.8 /100 | #90 | Exceptional 5.8% |
| Immigrants | Sudan | 98.8 /100 | #91 | Exceptional 5.8% |
| Immigrants | Sierra Leone | 98.6 /100 | #92 | Exceptional 5.8% |
| Immigrants | Denmark | 98.6 /100 | #93 | Exceptional 5.8% |
| Kenyans | 98.4 /100 | #94 | Exceptional 5.8% |
| Immigrants | El Salvador | 98.4 /100 | #95 | Exceptional 5.8% |
| Salvadorans | 98.4 /100 | #96 | Exceptional 5.8% |
| Immigrants | Somalia | 98.3 /100 | #97 | Exceptional 5.8% |