Immigrants from Senegal vs Australian Ambulatory Disability
COMPARE
Immigrants from Senegal
Australian
Ambulatory Disability
Ambulatory Disability Comparison
Immigrants from Senegal
Australians
6.4%
AMBULATORY DISABILITY
1.7/ 100
METRIC RATING
240th/ 347
METRIC RANK
5.8%
AMBULATORY DISABILITY
98.8/ 100
METRIC RATING
90th/ 347
METRIC RANK
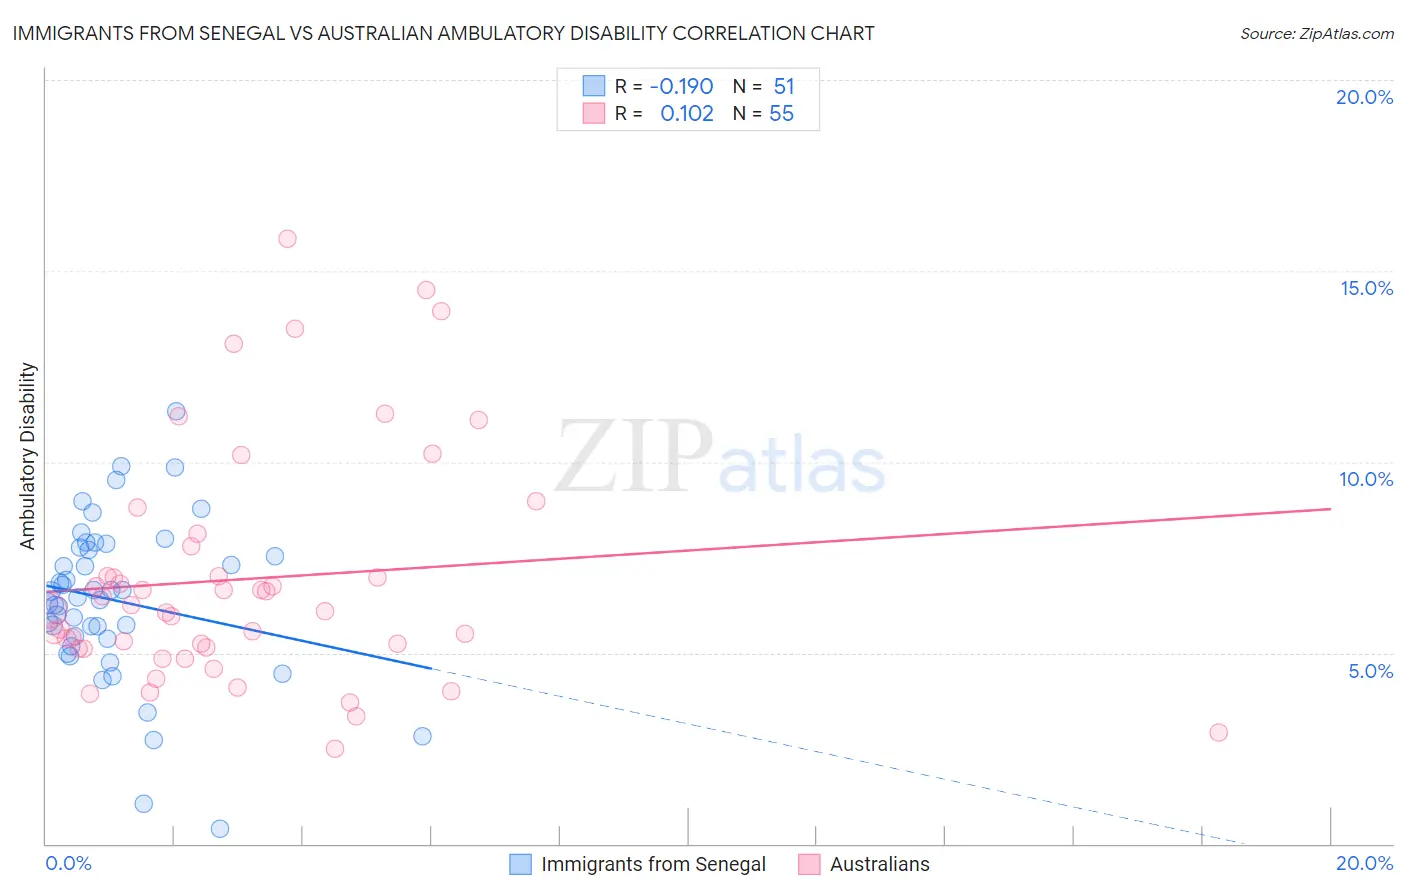
Immigrants from Senegal vs Australian Ambulatory Disability Correlation Chart
The statistical analysis conducted on geographies consisting of 90,127,972 people shows a poor negative correlation between the proportion of Immigrants from Senegal and percentage of population with ambulatory disability in the United States with a correlation coefficient (R) of -0.190 and weighted average of 6.4%. Similarly, the statistical analysis conducted on geographies consisting of 224,102,055 people shows a poor positive correlation between the proportion of Australians and percentage of population with ambulatory disability in the United States with a correlation coefficient (R) of 0.102 and weighted average of 5.8%, a difference of 11.9%.
Ambulatory Disability Correlation Summary
| Measurement | Immigrants from Senegal | Australian |
| Minimum | 0.40% | 2.5% |
| Maximum | 11.3% | 15.8% |
| Range | 10.9% | 13.3% |
| Mean | 6.4% | 6.9% |
| Median | 6.4% | 6.1% |
| Interquartile 25% (IQ1) | 5.4% | 5.1% |
| Interquartile 75% (IQ3) | 7.7% | 7.8% |
| Interquartile Range (IQR) | 2.4% | 2.7% |
| Standard Deviation (Sample) | 2.1% | 3.0% |
| Standard Deviation (Population) | 2.1% | 3.0% |
Similar Demographics by Ambulatory Disability
Demographics Similar to Immigrants from Senegal by Ambulatory Disability
In terms of ambulatory disability, the demographic groups most similar to Immigrants from Senegal are Senegalese (6.4%, a difference of 0.030%), Immigrants from Haiti (6.5%, a difference of 0.080%), Haitian (6.4%, a difference of 0.090%), Immigrants from Germany (6.4%, a difference of 0.10%), and Spaniard (6.5%, a difference of 0.11%).
| Demographics | Rating | Rank | Ambulatory Disability |
| Sub-Saharan Africans | 2.3 /100 | #233 | Tragic 6.4% |
| Immigrants | Liberia | 2.3 /100 | #234 | Tragic 6.4% |
| Hispanics or Latinos | 2.2 /100 | #235 | Tragic 6.4% |
| Dutch | 2.0 /100 | #236 | Tragic 6.4% |
| Immigrants | Germany | 1.8 /100 | #237 | Tragic 6.4% |
| Haitians | 1.8 /100 | #238 | Tragic 6.4% |
| Senegalese | 1.7 /100 | #239 | Tragic 6.4% |
| Immigrants | Senegal | 1.7 /100 | #240 | Tragic 6.4% |
| Immigrants | Haiti | 1.6 /100 | #241 | Tragic 6.5% |
| Spaniards | 1.6 /100 | #242 | Tragic 6.5% |
| Germans | 1.5 /100 | #243 | Tragic 6.5% |
| Immigrants | Panama | 1.5 /100 | #244 | Tragic 6.5% |
| Tlingit-Haida | 1.5 /100 | #245 | Tragic 6.5% |
| Armenians | 1.5 /100 | #246 | Tragic 6.5% |
| Immigrants | Cuba | 1.4 /100 | #247 | Tragic 6.5% |
Demographics Similar to Australians by Ambulatory Disability
In terms of ambulatory disability, the demographic groups most similar to Australians are Bhutanese (5.8%, a difference of 0.0%), Immigrants from Sudan (5.8%, a difference of 0.0%), Soviet Union (5.8%, a difference of 0.12%), Immigrants from Chile (5.8%, a difference of 0.16%), and Immigrants from Sierra Leone (5.8%, a difference of 0.17%).
| Demographics | Rating | Rank | Ambulatory Disability |
| Eastern Europeans | 99.2 /100 | #83 | Exceptional 5.7% |
| Ugandans | 99.2 /100 | #84 | Exceptional 5.7% |
| South Americans | 99.0 /100 | #85 | Exceptional 5.7% |
| Latvians | 99.0 /100 | #86 | Exceptional 5.7% |
| Immigrants | Chile | 98.9 /100 | #87 | Exceptional 5.8% |
| Soviet Union | 98.9 /100 | #88 | Exceptional 5.8% |
| Bhutanese | 98.8 /100 | #89 | Exceptional 5.8% |
| Australians | 98.8 /100 | #90 | Exceptional 5.8% |
| Immigrants | Sudan | 98.8 /100 | #91 | Exceptional 5.8% |
| Immigrants | Sierra Leone | 98.6 /100 | #92 | Exceptional 5.8% |
| Immigrants | Denmark | 98.6 /100 | #93 | Exceptional 5.8% |
| Kenyans | 98.4 /100 | #94 | Exceptional 5.8% |
| Immigrants | El Salvador | 98.4 /100 | #95 | Exceptional 5.8% |
| Salvadorans | 98.4 /100 | #96 | Exceptional 5.8% |
| Immigrants | Somalia | 98.3 /100 | #97 | Exceptional 5.8% |