Finnish vs Australian 9th Grade
COMPARE
Finnish
Australian
9th Grade
9th Grade Comparison
Finns
Australians
96.6%
9TH GRADE
100.0/ 100
METRIC RATING
11th/ 347
METRIC RANK
96.0%
9TH GRADE
99.9/ 100
METRIC RATING
48th/ 347
METRIC RANK
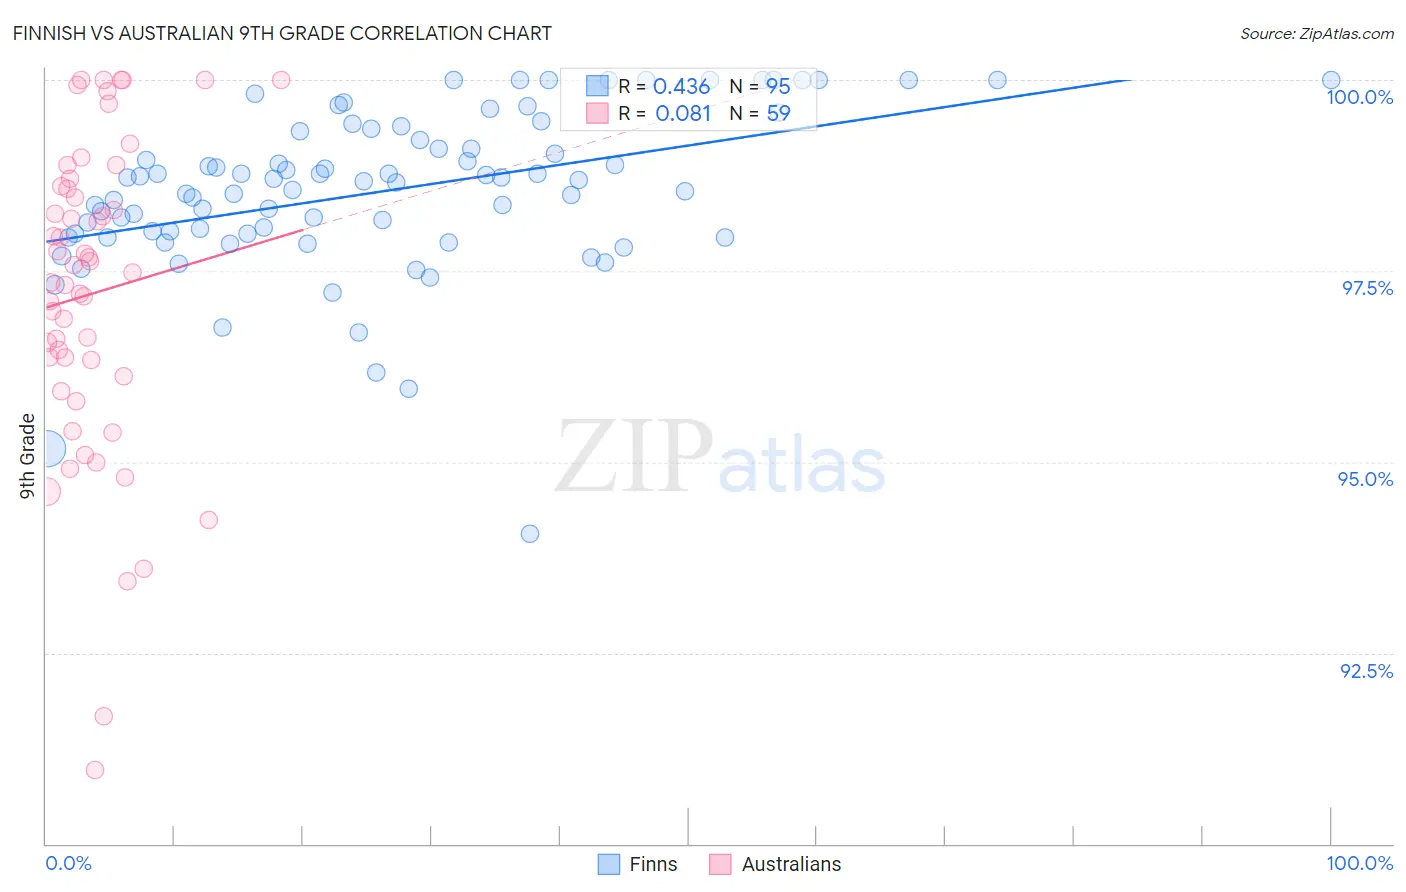
Finnish vs Australian 9th Grade Correlation Chart
The statistical analysis conducted on geographies consisting of 404,676,377 people shows a moderate positive correlation between the proportion of Finns and percentage of population with at least 9th grade education in the United States with a correlation coefficient (R) of 0.436 and weighted average of 96.6%. Similarly, the statistical analysis conducted on geographies consisting of 224,153,693 people shows a slight positive correlation between the proportion of Australians and percentage of population with at least 9th grade education in the United States with a correlation coefficient (R) of 0.081 and weighted average of 96.0%, a difference of 0.57%.
9th Grade Correlation Summary
| Measurement | Finnish | Australian |
| Minimum | 94.1% | 91.0% |
| Maximum | 100.0% | 100.0% |
| Range | 5.9% | 9.0% |
| Mean | 98.5% | 97.2% |
| Median | 98.7% | 97.5% |
| Interquartile 25% (IQ1) | 98.0% | 96.1% |
| Interquartile 75% (IQ3) | 99.3% | 98.6% |
| Interquartile Range (IQR) | 1.3% | 2.5% |
| Standard Deviation (Sample) | 1.1% | 2.0% |
| Standard Deviation (Population) | 1.1% | 2.0% |
Similar Demographics by 9th Grade
Demographics Similar to Finns by 9th Grade
In terms of 9th grade, the demographic groups most similar to Finns are Lithuanian (96.6%, a difference of 0.0%), English (96.6%, a difference of 0.020%), Tlingit-Haida (96.6%, a difference of 0.040%), Danish (96.5%, a difference of 0.070%), and Scottish (96.5%, a difference of 0.070%).
| Demographics | Rating | Rank | 9th Grade |
| Slovenes | 100.0 /100 | #4 | Exceptional 96.7% |
| Swedes | 100.0 /100 | #5 | Exceptional 96.7% |
| Poles | 100.0 /100 | #6 | Exceptional 96.7% |
| Carpatho Rusyns | 100.0 /100 | #7 | Exceptional 96.7% |
| Germans | 100.0 /100 | #8 | Exceptional 96.7% |
| Tlingit-Haida | 100.0 /100 | #9 | Exceptional 96.6% |
| Lithuanians | 100.0 /100 | #10 | Exceptional 96.6% |
| Finns | 100.0 /100 | #11 | Exceptional 96.6% |
| English | 100.0 /100 | #12 | Exceptional 96.6% |
| Danes | 100.0 /100 | #13 | Exceptional 96.5% |
| Scottish | 100.0 /100 | #14 | Exceptional 96.5% |
| Irish | 100.0 /100 | #15 | Exceptional 96.5% |
| Croatians | 100.0 /100 | #16 | Exceptional 96.5% |
| Dutch | 100.0 /100 | #17 | Exceptional 96.5% |
| Scandinavians | 100.0 /100 | #18 | Exceptional 96.5% |
Demographics Similar to Australians by 9th Grade
In terms of 9th grade, the demographic groups most similar to Australians are Russian (96.0%, a difference of 0.0%), Crow (96.1%, a difference of 0.010%), Immigrants from India (96.1%, a difference of 0.010%), Greek (96.0%, a difference of 0.010%), and Alaska Native (96.1%, a difference of 0.020%).
| Demographics | Rating | Rank | 9th Grade |
| Czechoslovakians | 99.9 /100 | #41 | Exceptional 96.1% |
| Chippewa | 99.9 /100 | #42 | Exceptional 96.1% |
| Iranians | 99.9 /100 | #43 | Exceptional 96.1% |
| Alaska Natives | 99.9 /100 | #44 | Exceptional 96.1% |
| Crow | 99.9 /100 | #45 | Exceptional 96.1% |
| Immigrants | India | 99.9 /100 | #46 | Exceptional 96.1% |
| Russians | 99.9 /100 | #47 | Exceptional 96.0% |
| Australians | 99.9 /100 | #48 | Exceptional 96.0% |
| Greeks | 99.9 /100 | #49 | Exceptional 96.0% |
| Celtics | 99.9 /100 | #50 | Exceptional 96.0% |
| Immigrants | Northern Europe | 99.9 /100 | #51 | Exceptional 96.0% |
| Serbians | 99.9 /100 | #52 | Exceptional 96.0% |
| Austrians | 99.8 /100 | #53 | Exceptional 96.0% |
| Immigrants | Canada | 99.8 /100 | #54 | Exceptional 96.0% |
| Immigrants | Austria | 99.8 /100 | #55 | Exceptional 96.0% |