Dominican vs Chickasaw Disability
COMPARE
Dominican
Chickasaw
Disability
Disability Comparison
Dominicans
Chickasaw
12.7%
DISABILITY
0.0/ 100
METRIC RATING
272nd/ 347
METRIC RANK
15.2%
DISABILITY
0.0/ 100
METRIC RATING
339th/ 347
METRIC RANK
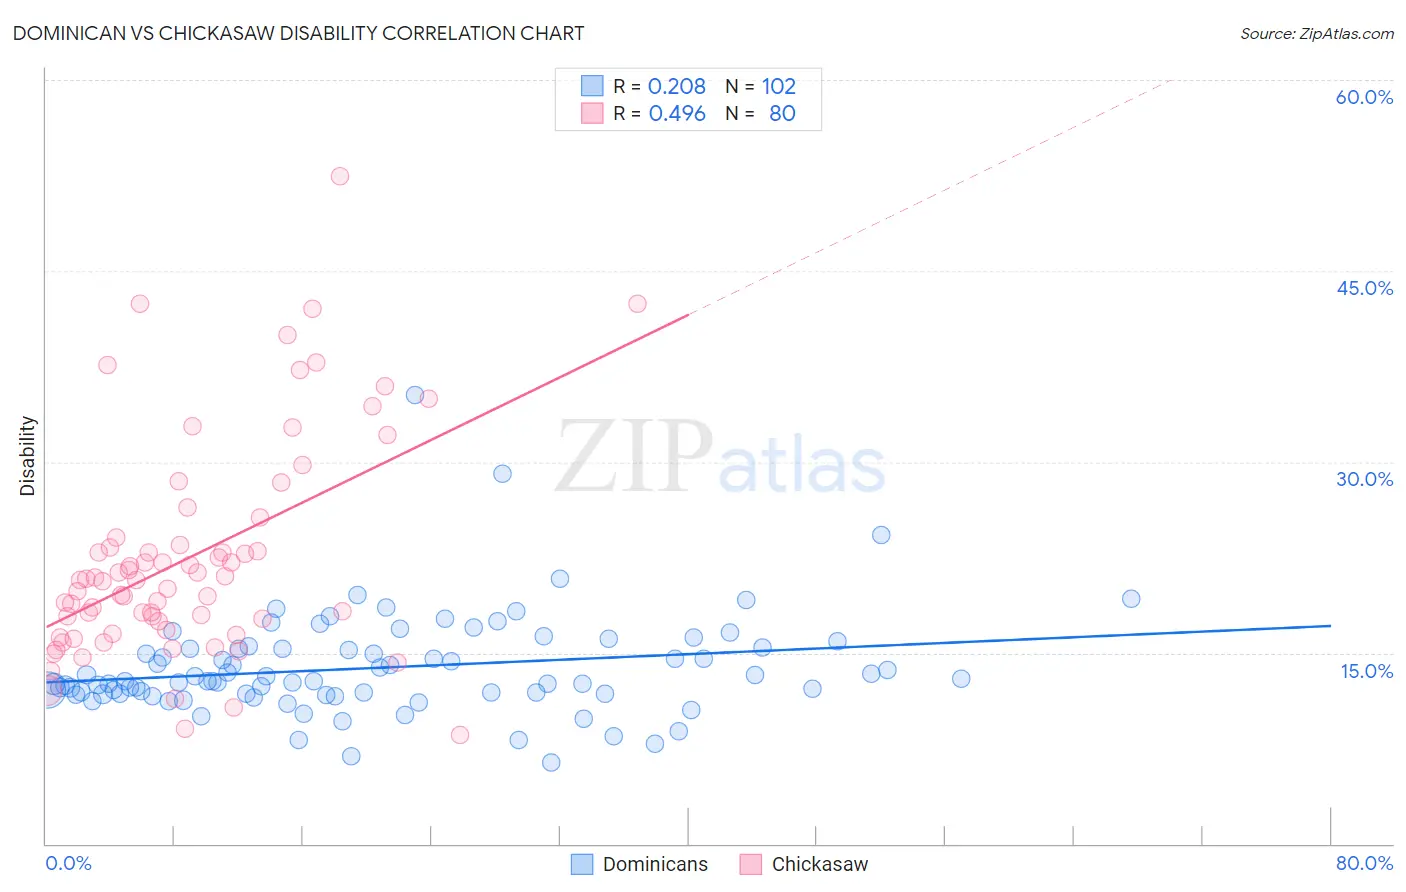
Dominican vs Chickasaw Disability Correlation Chart
The statistical analysis conducted on geographies consisting of 355,062,868 people shows a weak positive correlation between the proportion of Dominicans and percentage of population with a disability in the United States with a correlation coefficient (R) of 0.208 and weighted average of 12.7%. Similarly, the statistical analysis conducted on geographies consisting of 147,689,192 people shows a moderate positive correlation between the proportion of Chickasaw and percentage of population with a disability in the United States with a correlation coefficient (R) of 0.496 and weighted average of 15.2%, a difference of 19.6%.
Disability Correlation Summary
| Measurement | Dominican | Chickasaw |
| Minimum | 6.4% | 8.6% |
| Maximum | 35.3% | 52.4% |
| Range | 28.9% | 43.9% |
| Mean | 13.8% | 22.5% |
| Median | 12.8% | 20.7% |
| Interquartile 25% (IQ1) | 11.8% | 17.1% |
| Interquartile 75% (IQ3) | 15.3% | 23.7% |
| Interquartile Range (IQR) | 3.5% | 6.6% |
| Standard Deviation (Sample) | 4.0% | 8.6% |
| Standard Deviation (Population) | 4.0% | 8.5% |
Similar Demographics by Disability
Demographics Similar to Dominicans by Disability
In terms of disability, the demographic groups most similar to Dominicans are Finnish (12.7%, a difference of 0.16%), Immigrants from Yemen (12.6%, a difference of 0.49%), Portuguese (12.6%, a difference of 0.54%), Nepalese (12.8%, a difference of 0.60%), and Sioux (12.8%, a difference of 0.68%).
| Demographics | Rating | Rank | Disability |
| U.S. Virgin Islanders | 0.2 /100 | #265 | Tragic 12.5% |
| Czechoslovakians | 0.2 /100 | #266 | Tragic 12.5% |
| Spaniards | 0.2 /100 | #267 | Tragic 12.5% |
| Bangladeshis | 0.1 /100 | #268 | Tragic 12.6% |
| Immigrants | Dominican Republic | 0.1 /100 | #269 | Tragic 12.6% |
| Portuguese | 0.1 /100 | #270 | Tragic 12.6% |
| Immigrants | Yemen | 0.1 /100 | #271 | Tragic 12.6% |
| Dominicans | 0.0 /100 | #272 | Tragic 12.7% |
| Finns | 0.0 /100 | #273 | Tragic 12.7% |
| Nepalese | 0.0 /100 | #274 | Tragic 12.8% |
| Sioux | 0.0 /100 | #275 | Tragic 12.8% |
| Hmong | 0.0 /100 | #276 | Tragic 12.8% |
| Dutch | 0.0 /100 | #277 | Tragic 12.8% |
| Germans | 0.0 /100 | #278 | Tragic 12.8% |
| Fijians | 0.0 /100 | #279 | Tragic 12.8% |
Demographics Similar to Chickasaw by Disability
In terms of disability, the demographic groups most similar to Chickasaw are Choctaw (15.4%, a difference of 1.5%), Dutch West Indian (14.9%, a difference of 1.8%), Seminole (14.9%, a difference of 2.1%), Cherokee (14.8%, a difference of 2.2%), and Lumbee (15.5%, a difference of 2.3%).
| Demographics | Rating | Rank | Disability |
| Pueblo | 0.0 /100 | #332 | Tragic 14.4% |
| Cajuns | 0.0 /100 | #333 | Tragic 14.6% |
| Yuman | 0.0 /100 | #334 | Tragic 14.6% |
| Tohono O'odham | 0.0 /100 | #335 | Tragic 14.8% |
| Cherokee | 0.0 /100 | #336 | Tragic 14.8% |
| Seminole | 0.0 /100 | #337 | Tragic 14.9% |
| Dutch West Indians | 0.0 /100 | #338 | Tragic 14.9% |
| Chickasaw | 0.0 /100 | #339 | Tragic 15.2% |
| Choctaw | 0.0 /100 | #340 | Tragic 15.4% |
| Lumbee | 0.0 /100 | #341 | Tragic 15.5% |
| Kiowa | 0.0 /100 | #342 | Tragic 15.6% |
| Creek | 0.0 /100 | #343 | Tragic 15.6% |
| Colville | 0.0 /100 | #344 | Tragic 15.8% |
| Puerto Ricans | 0.0 /100 | #345 | Tragic 16.1% |
| Tsimshian | 0.0 /100 | #346 | Tragic 16.1% |