Dominican vs Immigrants from Western Europe Disability
COMPARE
Dominican
Immigrants from Western Europe
Disability
Disability Comparison
Dominicans
Immigrants from Western Europe
12.7%
DISABILITY
0.0/ 100
METRIC RATING
272nd/ 347
METRIC RANK
12.0%
DISABILITY
10.1/ 100
METRIC RATING
205th/ 347
METRIC RANK
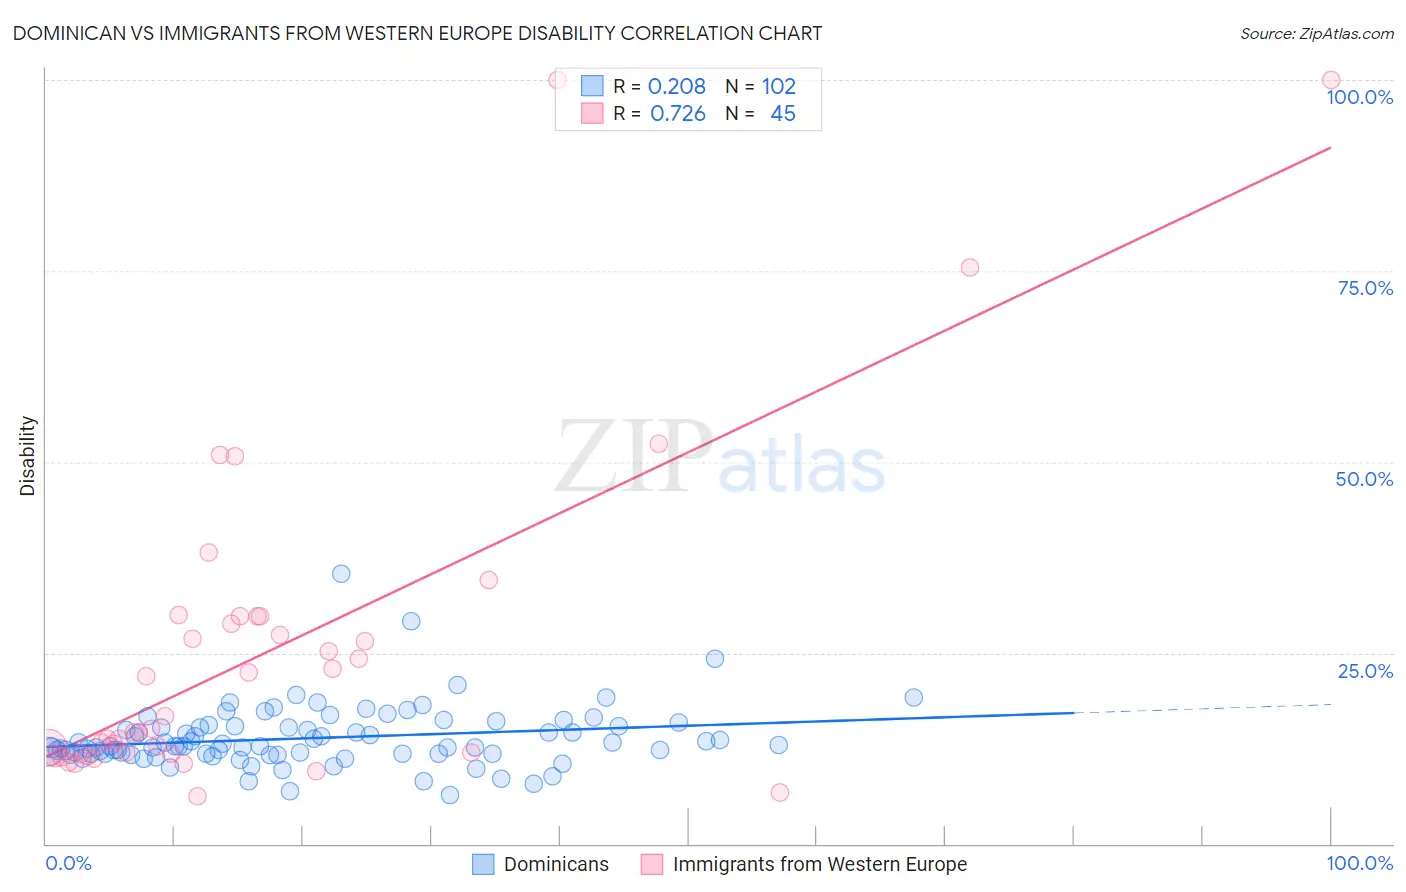
Dominican vs Immigrants from Western Europe Disability Correlation Chart
The statistical analysis conducted on geographies consisting of 355,062,868 people shows a weak positive correlation between the proportion of Dominicans and percentage of population with a disability in the United States with a correlation coefficient (R) of 0.208 and weighted average of 12.7%. Similarly, the statistical analysis conducted on geographies consisting of 494,041,803 people shows a strong positive correlation between the proportion of Immigrants from Western Europe and percentage of population with a disability in the United States with a correlation coefficient (R) of 0.726 and weighted average of 12.0%, a difference of 5.9%.
Disability Correlation Summary
| Measurement | Dominican | Immigrants from Western Europe |
| Minimum | 6.4% | 6.3% |
| Maximum | 35.3% | 100.0% |
| Range | 28.9% | 93.7% |
| Mean | 13.8% | 25.2% |
| Median | 12.8% | 15.0% |
| Interquartile 25% (IQ1) | 11.8% | 11.7% |
| Interquartile 75% (IQ3) | 15.3% | 29.8% |
| Interquartile Range (IQR) | 3.5% | 18.0% |
| Standard Deviation (Sample) | 4.0% | 21.6% |
| Standard Deviation (Population) | 4.0% | 21.3% |
Similar Demographics by Disability
Demographics Similar to Dominicans by Disability
In terms of disability, the demographic groups most similar to Dominicans are Finnish (12.7%, a difference of 0.16%), Immigrants from Yemen (12.6%, a difference of 0.49%), Portuguese (12.6%, a difference of 0.54%), Nepalese (12.8%, a difference of 0.60%), and Sioux (12.8%, a difference of 0.68%).
| Demographics | Rating | Rank | Disability |
| U.S. Virgin Islanders | 0.2 /100 | #265 | Tragic 12.5% |
| Czechoslovakians | 0.2 /100 | #266 | Tragic 12.5% |
| Spaniards | 0.2 /100 | #267 | Tragic 12.5% |
| Bangladeshis | 0.1 /100 | #268 | Tragic 12.6% |
| Immigrants | Dominican Republic | 0.1 /100 | #269 | Tragic 12.6% |
| Portuguese | 0.1 /100 | #270 | Tragic 12.6% |
| Immigrants | Yemen | 0.1 /100 | #271 | Tragic 12.6% |
| Dominicans | 0.0 /100 | #272 | Tragic 12.7% |
| Finns | 0.0 /100 | #273 | Tragic 12.7% |
| Nepalese | 0.0 /100 | #274 | Tragic 12.8% |
| Sioux | 0.0 /100 | #275 | Tragic 12.8% |
| Hmong | 0.0 /100 | #276 | Tragic 12.8% |
| Dutch | 0.0 /100 | #277 | Tragic 12.8% |
| Germans | 0.0 /100 | #278 | Tragic 12.8% |
| Fijians | 0.0 /100 | #279 | Tragic 12.8% |
Demographics Similar to Immigrants from Western Europe by Disability
In terms of disability, the demographic groups most similar to Immigrants from Western Europe are Immigrants from Senegal (12.0%, a difference of 0.080%), Immigrants from Thailand (12.0%, a difference of 0.10%), Immigrants from Caribbean (12.0%, a difference of 0.12%), British West Indian (12.0%, a difference of 0.16%), and Mexican American Indian (12.0%, a difference of 0.16%).
| Demographics | Rating | Rank | Disability |
| Ukrainians | 14.7 /100 | #198 | Poor 11.9% |
| Immigrants | Panama | 14.6 /100 | #199 | Poor 11.9% |
| Belizeans | 12.8 /100 | #200 | Poor 11.9% |
| Assyrians/Chaldeans/Syriacs | 12.6 /100 | #201 | Poor 11.9% |
| Immigrants | England | 12.0 /100 | #202 | Poor 12.0% |
| British West Indians | 11.5 /100 | #203 | Poor 12.0% |
| Mexican American Indians | 11.4 /100 | #204 | Poor 12.0% |
| Immigrants | Western Europe | 10.1 /100 | #205 | Poor 12.0% |
| Immigrants | Senegal | 9.4 /100 | #206 | Tragic 12.0% |
| Immigrants | Thailand | 9.3 /100 | #207 | Tragic 12.0% |
| Immigrants | Caribbean | 9.1 /100 | #208 | Tragic 12.0% |
| Danes | 8.7 /100 | #209 | Tragic 12.0% |
| Czechs | 7.9 /100 | #210 | Tragic 12.0% |
| Immigrants | Cambodia | 7.3 /100 | #211 | Tragic 12.0% |
| Austrians | 7.2 /100 | #212 | Tragic 12.0% |