Bhutanese vs Chickasaw Disability
COMPARE
Bhutanese
Chickasaw
Disability
Disability Comparison
Bhutanese
Chickasaw
11.2%
DISABILITY
97.4/ 100
METRIC RATING
97th/ 347
METRIC RANK
15.2%
DISABILITY
0.0/ 100
METRIC RATING
339th/ 347
METRIC RANK
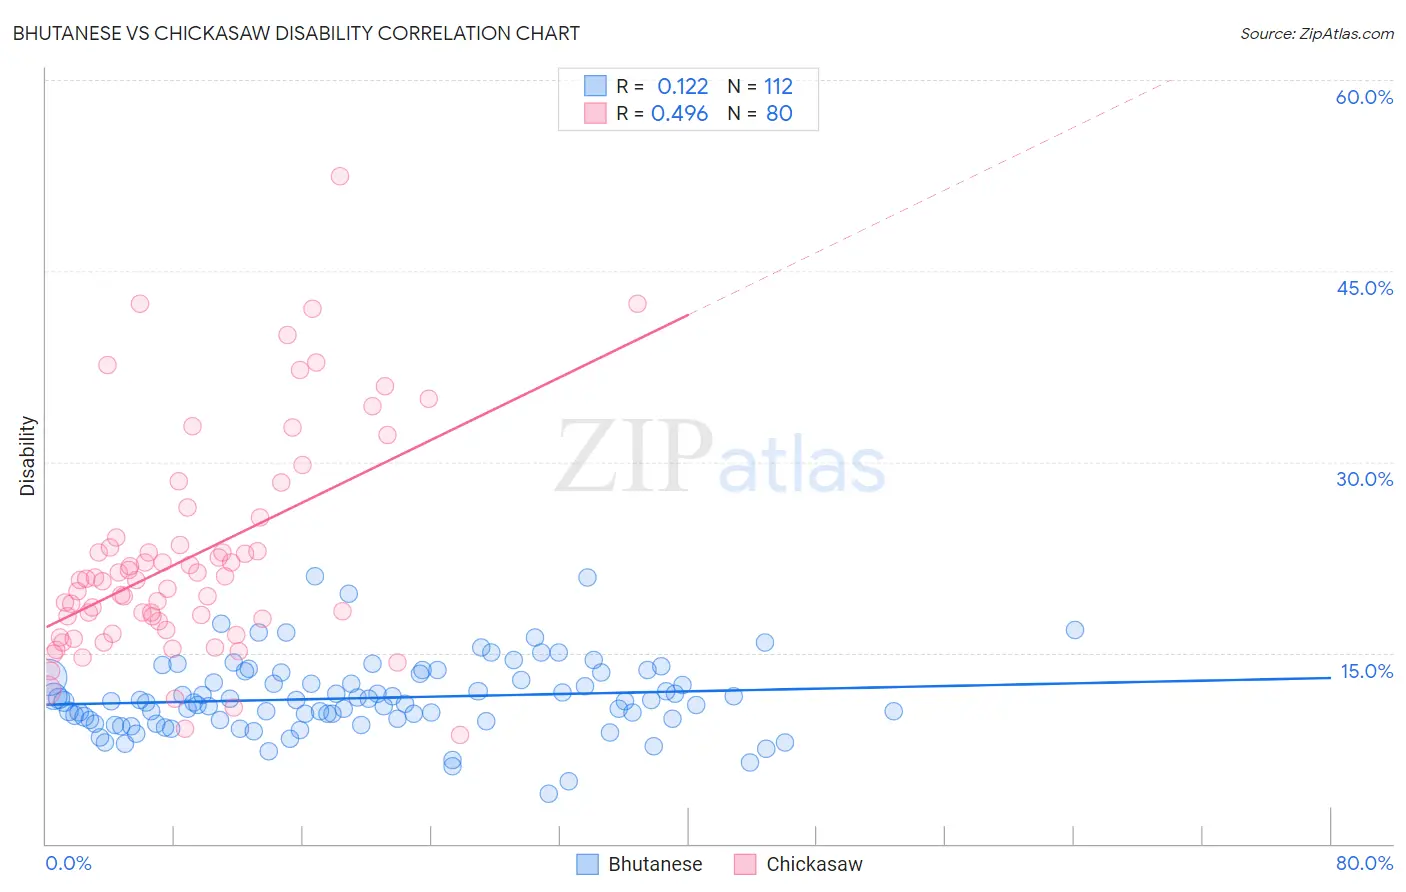
Bhutanese vs Chickasaw Disability Correlation Chart
The statistical analysis conducted on geographies consisting of 455,521,093 people shows a poor positive correlation between the proportion of Bhutanese and percentage of population with a disability in the United States with a correlation coefficient (R) of 0.122 and weighted average of 11.2%. Similarly, the statistical analysis conducted on geographies consisting of 147,689,192 people shows a moderate positive correlation between the proportion of Chickasaw and percentage of population with a disability in the United States with a correlation coefficient (R) of 0.496 and weighted average of 15.2%, a difference of 35.1%.
Disability Correlation Summary
| Measurement | Bhutanese | Chickasaw |
| Minimum | 4.0% | 8.6% |
| Maximum | 21.0% | 52.4% |
| Range | 17.0% | 43.9% |
| Mean | 11.5% | 22.5% |
| Median | 11.2% | 20.7% |
| Interquartile 25% (IQ1) | 9.7% | 17.1% |
| Interquartile 75% (IQ3) | 13.2% | 23.7% |
| Interquartile Range (IQR) | 3.5% | 6.6% |
| Standard Deviation (Sample) | 2.9% | 8.6% |
| Standard Deviation (Population) | 2.9% | 8.5% |
Similar Demographics by Disability
Demographics Similar to Bhutanese by Disability
In terms of disability, the demographic groups most similar to Bhutanese are Uruguayan (11.2%, a difference of 0.0%), Immigrants from Czechoslovakia (11.2%, a difference of 0.010%), Immigrants from Zimbabwe (11.2%, a difference of 0.14%), Immigrants from Greece (11.3%, a difference of 0.18%), and Immigrants from Morocco (11.2%, a difference of 0.21%).
| Demographics | Rating | Rank | Disability |
| Immigrants | Brazil | 98.1 /100 | #90 | Exceptional 11.2% |
| Immigrants | Western Asia | 98.1 /100 | #91 | Exceptional 11.2% |
| Ecuadorians | 98.0 /100 | #92 | Exceptional 11.2% |
| Immigrants | Ecuador | 98.0 /100 | #93 | Exceptional 11.2% |
| Immigrants | Morocco | 97.8 /100 | #94 | Exceptional 11.2% |
| Eastern Europeans | 97.8 /100 | #95 | Exceptional 11.2% |
| Immigrants | Zimbabwe | 97.7 /100 | #96 | Exceptional 11.2% |
| Bhutanese | 97.4 /100 | #97 | Exceptional 11.2% |
| Uruguayans | 97.4 /100 | #98 | Exceptional 11.2% |
| Immigrants | Czechoslovakia | 97.4 /100 | #99 | Exceptional 11.2% |
| Immigrants | Greece | 96.9 /100 | #100 | Exceptional 11.3% |
| Immigrants | Nicaragua | 96.8 /100 | #101 | Exceptional 11.3% |
| Immigrants | Eastern Africa | 96.7 /100 | #102 | Exceptional 11.3% |
| Immigrants | Uruguay | 96.4 /100 | #103 | Exceptional 11.3% |
| Immigrants | Immigrants | 96.4 /100 | #104 | Exceptional 11.3% |
Demographics Similar to Chickasaw by Disability
In terms of disability, the demographic groups most similar to Chickasaw are Choctaw (15.4%, a difference of 1.5%), Dutch West Indian (14.9%, a difference of 1.8%), Seminole (14.9%, a difference of 2.1%), Cherokee (14.8%, a difference of 2.2%), and Lumbee (15.5%, a difference of 2.3%).
| Demographics | Rating | Rank | Disability |
| Pueblo | 0.0 /100 | #332 | Tragic 14.4% |
| Cajuns | 0.0 /100 | #333 | Tragic 14.6% |
| Yuman | 0.0 /100 | #334 | Tragic 14.6% |
| Tohono O'odham | 0.0 /100 | #335 | Tragic 14.8% |
| Cherokee | 0.0 /100 | #336 | Tragic 14.8% |
| Seminole | 0.0 /100 | #337 | Tragic 14.9% |
| Dutch West Indians | 0.0 /100 | #338 | Tragic 14.9% |
| Chickasaw | 0.0 /100 | #339 | Tragic 15.2% |
| Choctaw | 0.0 /100 | #340 | Tragic 15.4% |
| Lumbee | 0.0 /100 | #341 | Tragic 15.5% |
| Kiowa | 0.0 /100 | #342 | Tragic 15.6% |
| Creek | 0.0 /100 | #343 | Tragic 15.6% |
| Colville | 0.0 /100 | #344 | Tragic 15.8% |
| Puerto Ricans | 0.0 /100 | #345 | Tragic 16.1% |
| Tsimshian | 0.0 /100 | #346 | Tragic 16.1% |