Dominican vs Immigrants from France Disability
COMPARE
Dominican
Immigrants from France
Disability
Disability Comparison
Dominicans
Immigrants from France
12.7%
DISABILITY
0.0/ 100
METRIC RATING
272nd/ 347
METRIC RANK
11.0%
DISABILITY
99.4/ 100
METRIC RATING
70th/ 347
METRIC RANK
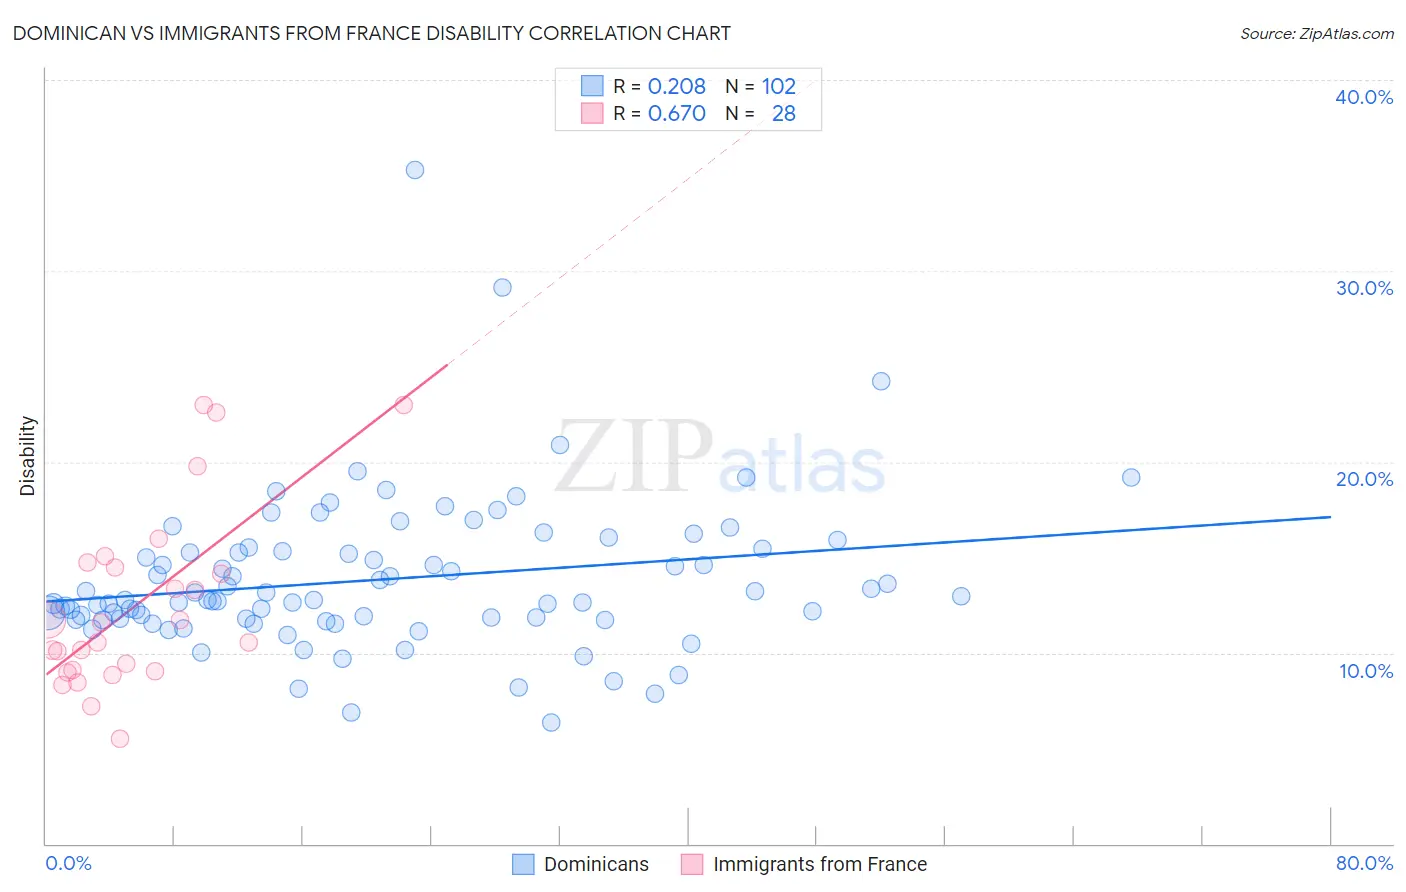
Dominican vs Immigrants from France Disability Correlation Chart
The statistical analysis conducted on geographies consisting of 355,062,868 people shows a weak positive correlation between the proportion of Dominicans and percentage of population with a disability in the United States with a correlation coefficient (R) of 0.208 and weighted average of 12.7%. Similarly, the statistical analysis conducted on geographies consisting of 287,909,175 people shows a significant positive correlation between the proportion of Immigrants from France and percentage of population with a disability in the United States with a correlation coefficient (R) of 0.670 and weighted average of 11.0%, a difference of 15.1%.
Disability Correlation Summary
| Measurement | Dominican | Immigrants from France |
| Minimum | 6.4% | 5.5% |
| Maximum | 35.3% | 23.0% |
| Range | 28.9% | 17.5% |
| Mean | 13.8% | 12.5% |
| Median | 12.8% | 11.1% |
| Interquartile 25% (IQ1) | 11.8% | 9.0% |
| Interquartile 75% (IQ3) | 15.3% | 14.6% |
| Interquartile Range (IQR) | 3.5% | 5.6% |
| Standard Deviation (Sample) | 4.0% | 4.7% |
| Standard Deviation (Population) | 4.0% | 4.6% |
Similar Demographics by Disability
Demographics Similar to Dominicans by Disability
In terms of disability, the demographic groups most similar to Dominicans are Finnish (12.7%, a difference of 0.16%), Immigrants from Yemen (12.6%, a difference of 0.49%), Portuguese (12.6%, a difference of 0.54%), Nepalese (12.8%, a difference of 0.60%), and Sioux (12.8%, a difference of 0.68%).
| Demographics | Rating | Rank | Disability |
| U.S. Virgin Islanders | 0.2 /100 | #265 | Tragic 12.5% |
| Czechoslovakians | 0.2 /100 | #266 | Tragic 12.5% |
| Spaniards | 0.2 /100 | #267 | Tragic 12.5% |
| Bangladeshis | 0.1 /100 | #268 | Tragic 12.6% |
| Immigrants | Dominican Republic | 0.1 /100 | #269 | Tragic 12.6% |
| Portuguese | 0.1 /100 | #270 | Tragic 12.6% |
| Immigrants | Yemen | 0.1 /100 | #271 | Tragic 12.6% |
| Dominicans | 0.0 /100 | #272 | Tragic 12.7% |
| Finns | 0.0 /100 | #273 | Tragic 12.7% |
| Nepalese | 0.0 /100 | #274 | Tragic 12.8% |
| Sioux | 0.0 /100 | #275 | Tragic 12.8% |
| Hmong | 0.0 /100 | #276 | Tragic 12.8% |
| Dutch | 0.0 /100 | #277 | Tragic 12.8% |
| Germans | 0.0 /100 | #278 | Tragic 12.8% |
| Fijians | 0.0 /100 | #279 | Tragic 12.8% |
Demographics Similar to Immigrants from France by Disability
In terms of disability, the demographic groups most similar to Immigrants from France are Immigrants from Lebanon (11.0%, a difference of 0.020%), Sri Lankan (11.0%, a difference of 0.080%), Immigrants from Chile (11.0%, a difference of 0.10%), Immigrants from Bangladesh (11.0%, a difference of 0.13%), and Immigrants from Serbia (11.0%, a difference of 0.15%).
| Demographics | Rating | Rank | Disability |
| Immigrants | Eritrea | 99.7 /100 | #63 | Exceptional 11.0% |
| Immigrants | Sweden | 99.6 /100 | #64 | Exceptional 11.0% |
| Bulgarians | 99.6 /100 | #65 | Exceptional 11.0% |
| Laotians | 99.6 /100 | #66 | Exceptional 11.0% |
| Colombians | 99.6 /100 | #67 | Exceptional 11.0% |
| Immigrants | Afghanistan | 99.6 /100 | #68 | Exceptional 11.0% |
| Sri Lankans | 99.5 /100 | #69 | Exceptional 11.0% |
| Immigrants | France | 99.4 /100 | #70 | Exceptional 11.0% |
| Immigrants | Lebanon | 99.4 /100 | #71 | Exceptional 11.0% |
| Immigrants | Chile | 99.4 /100 | #72 | Exceptional 11.0% |
| Immigrants | Bangladesh | 99.4 /100 | #73 | Exceptional 11.0% |
| Immigrants | Serbia | 99.4 /100 | #74 | Exceptional 11.0% |
| Immigrants | Vietnam | 99.4 /100 | #75 | Exceptional 11.0% |
| Sierra Leoneans | 99.3 /100 | #76 | Exceptional 11.0% |
| Immigrants | Belgium | 99.3 /100 | #77 | Exceptional 11.0% |