Dominican vs Yaqui Disability
COMPARE
Dominican
Yaqui
Disability
Disability Comparison
Dominicans
Yaqui
12.7%
DISABILITY
0.0/ 100
METRIC RATING
272nd/ 347
METRIC RANK
13.1%
DISABILITY
0.0/ 100
METRIC RATING
291st/ 347
METRIC RANK
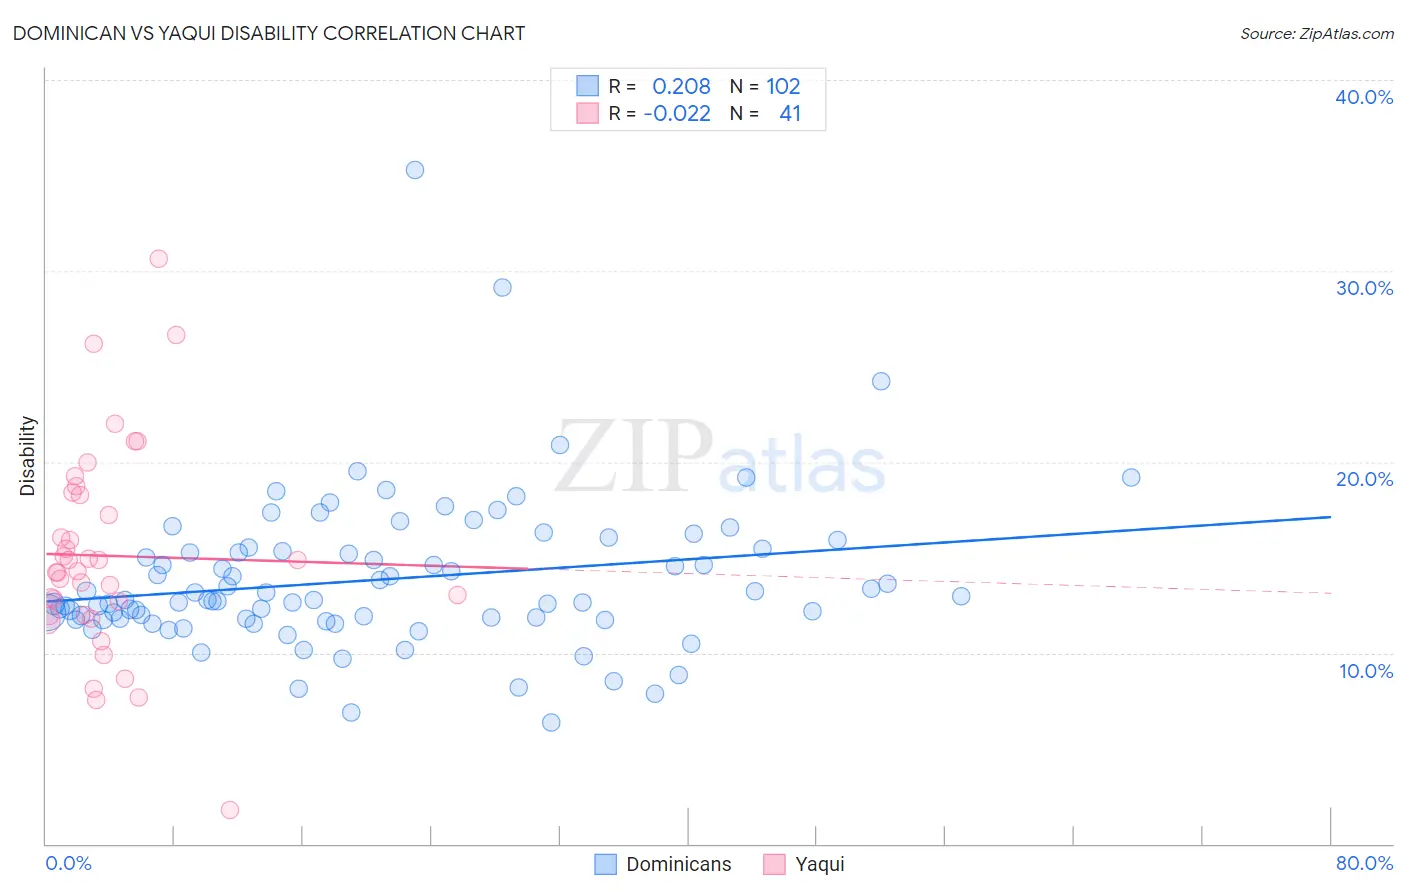
Dominican vs Yaqui Disability Correlation Chart
The statistical analysis conducted on geographies consisting of 355,062,868 people shows a weak positive correlation between the proportion of Dominicans and percentage of population with a disability in the United States with a correlation coefficient (R) of 0.208 and weighted average of 12.7%. Similarly, the statistical analysis conducted on geographies consisting of 107,721,250 people shows no correlation between the proportion of Yaqui and percentage of population with a disability in the United States with a correlation coefficient (R) of -0.022 and weighted average of 13.1%, a difference of 2.8%.
Disability Correlation Summary
| Measurement | Dominican | Yaqui |
| Minimum | 6.4% | 1.8% |
| Maximum | 35.3% | 30.6% |
| Range | 28.9% | 28.9% |
| Mean | 13.8% | 15.1% |
| Median | 12.8% | 14.3% |
| Interquartile 25% (IQ1) | 11.8% | 12.0% |
| Interquartile 75% (IQ3) | 15.3% | 18.3% |
| Interquartile Range (IQR) | 3.5% | 6.3% |
| Standard Deviation (Sample) | 4.0% | 5.5% |
| Standard Deviation (Population) | 4.0% | 5.4% |
Demographics Similar to Dominicans and Yaqui by Disability
In terms of disability, the demographic groups most similar to Dominicans are Finnish (12.7%, a difference of 0.16%), Immigrants from Yemen (12.6%, a difference of 0.49%), Nepalese (12.8%, a difference of 0.60%), Sioux (12.8%, a difference of 0.68%), and Hmong (12.8%, a difference of 0.83%). Similarly, the demographic groups most similar to Yaqui are Cheyenne (13.0%, a difference of 0.23%), Slovak (13.0%, a difference of 0.28%), White/Caucasian (13.0%, a difference of 0.29%), African (13.0%, a difference of 0.31%), and English (13.0%, a difference of 0.72%).
| Demographics | Rating | Rank | Disability |
| Immigrants | Yemen | 0.1 /100 | #271 | Tragic 12.6% |
| Dominicans | 0.0 /100 | #272 | Tragic 12.7% |
| Finns | 0.0 /100 | #273 | Tragic 12.7% |
| Nepalese | 0.0 /100 | #274 | Tragic 12.8% |
| Sioux | 0.0 /100 | #275 | Tragic 12.8% |
| Hmong | 0.0 /100 | #276 | Tragic 12.8% |
| Dutch | 0.0 /100 | #277 | Tragic 12.8% |
| Germans | 0.0 /100 | #278 | Tragic 12.8% |
| Fijians | 0.0 /100 | #279 | Tragic 12.8% |
| Spanish | 0.0 /100 | #280 | Tragic 12.8% |
| Immigrants | Portugal | 0.0 /100 | #281 | Tragic 12.9% |
| Scottish | 0.0 /100 | #282 | Tragic 12.9% |
| Irish | 0.0 /100 | #283 | Tragic 12.9% |
| Welsh | 0.0 /100 | #284 | Tragic 12.9% |
| Crow | 0.0 /100 | #285 | Tragic 12.9% |
| English | 0.0 /100 | #286 | Tragic 13.0% |
| Africans | 0.0 /100 | #287 | Tragic 13.0% |
| Whites/Caucasians | 0.0 /100 | #288 | Tragic 13.0% |
| Slovaks | 0.0 /100 | #289 | Tragic 13.0% |
| Cheyenne | 0.0 /100 | #290 | Tragic 13.0% |
| Yaqui | 0.0 /100 | #291 | Tragic 13.1% |