Immigrants from South Eastern Asia vs Chickasaw Disability
COMPARE
Immigrants from South Eastern Asia
Chickasaw
Disability
Disability Comparison
Immigrants from South Eastern Asia
Chickasaw
11.3%
DISABILITY
95.4/ 100
METRIC RATING
111th/ 347
METRIC RANK
15.2%
DISABILITY
0.0/ 100
METRIC RATING
339th/ 347
METRIC RANK
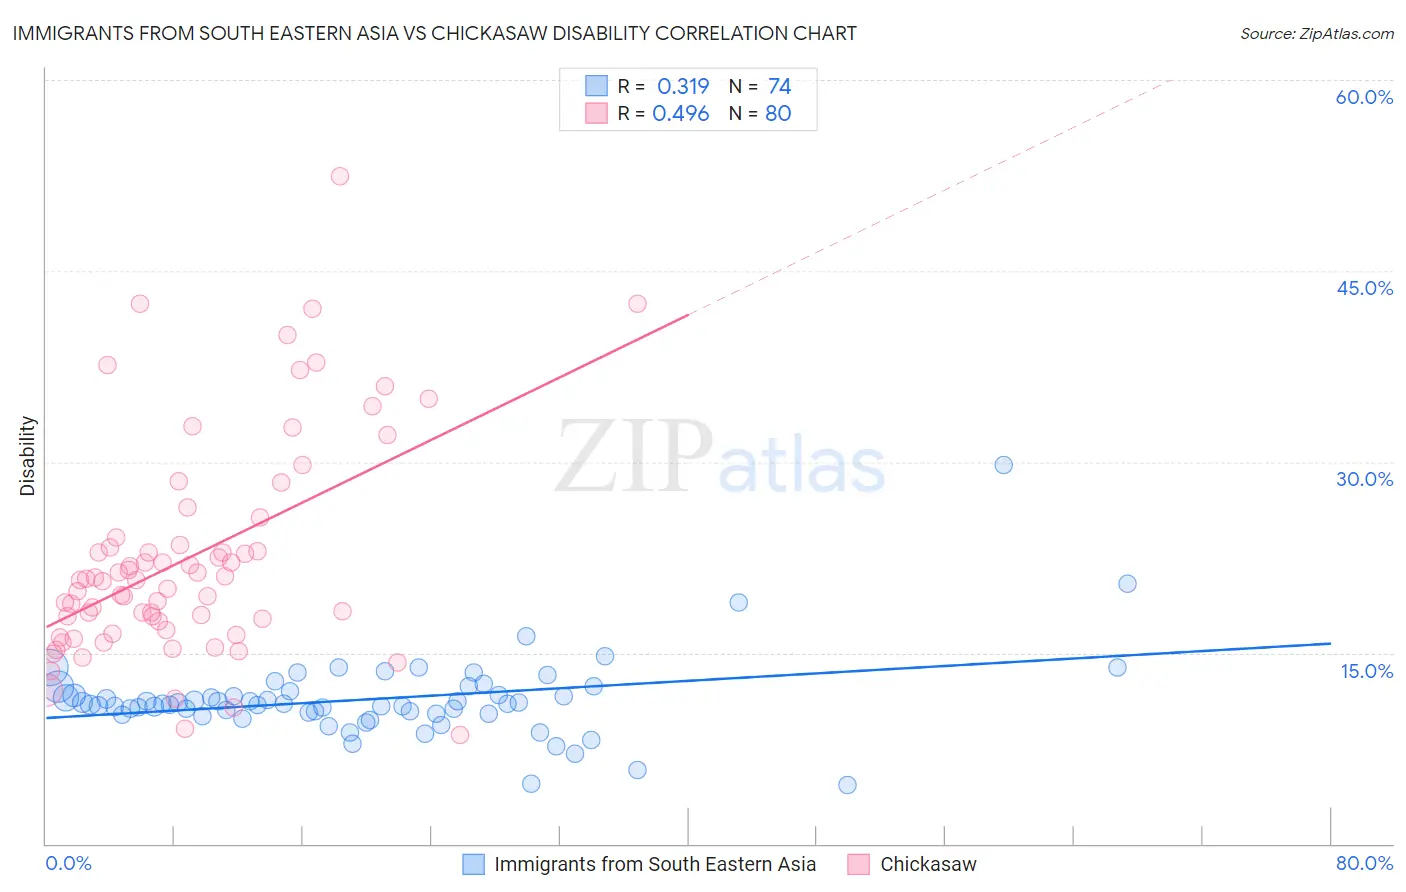
Immigrants from South Eastern Asia vs Chickasaw Disability Correlation Chart
The statistical analysis conducted on geographies consisting of 512,586,724 people shows a mild positive correlation between the proportion of Immigrants from South Eastern Asia and percentage of population with a disability in the United States with a correlation coefficient (R) of 0.319 and weighted average of 11.3%. Similarly, the statistical analysis conducted on geographies consisting of 147,689,192 people shows a moderate positive correlation between the proportion of Chickasaw and percentage of population with a disability in the United States with a correlation coefficient (R) of 0.496 and weighted average of 15.2%, a difference of 34.2%.
Disability Correlation Summary
| Measurement | Immigrants from South Eastern Asia | Chickasaw |
| Minimum | 4.6% | 8.6% |
| Maximum | 29.8% | 52.4% |
| Range | 25.2% | 43.9% |
| Mean | 11.4% | 22.5% |
| Median | 11.0% | 20.7% |
| Interquartile 25% (IQ1) | 10.3% | 17.1% |
| Interquartile 75% (IQ3) | 12.0% | 23.7% |
| Interquartile Range (IQR) | 1.7% | 6.6% |
| Standard Deviation (Sample) | 3.3% | 8.6% |
| Standard Deviation (Population) | 3.3% | 8.5% |
Similar Demographics by Disability
Demographics Similar to Immigrants from South Eastern Asia by Disability
In terms of disability, the demographic groups most similar to Immigrants from South Eastern Asia are Immigrants from Denmark (11.3%, a difference of 0.070%), Immigrants from Uganda (11.3%, a difference of 0.080%), Immigrants from Uzbekistan (11.3%, a difference of 0.12%), Guyanese (11.3%, a difference of 0.16%), and Immigrants from Nigeria (11.3%, a difference of 0.17%).
| Demographics | Rating | Rank | Disability |
| Immigrants | Immigrants | 96.4 /100 | #104 | Exceptional 11.3% |
| Immigrants | Kazakhstan | 96.4 /100 | #105 | Exceptional 11.3% |
| Immigrants | Eastern Europe | 96.3 /100 | #106 | Exceptional 11.3% |
| Nicaraguans | 96.2 /100 | #107 | Exceptional 11.3% |
| Immigrants | Nigeria | 96.0 /100 | #108 | Exceptional 11.3% |
| Immigrants | Uganda | 95.7 /100 | #109 | Exceptional 11.3% |
| Immigrants | Denmark | 95.6 /100 | #110 | Exceptional 11.3% |
| Immigrants | South Eastern Asia | 95.4 /100 | #111 | Exceptional 11.3% |
| Immigrants | Uzbekistan | 94.9 /100 | #112 | Exceptional 11.3% |
| Guyanese | 94.7 /100 | #113 | Exceptional 11.3% |
| Immigrants | Syria | 94.7 /100 | #114 | Exceptional 11.3% |
| Immigrants | Philippines | 94.6 /100 | #115 | Exceptional 11.3% |
| Immigrants | Northern Europe | 94.1 /100 | #116 | Exceptional 11.3% |
| Luxembourgers | 93.9 /100 | #117 | Exceptional 11.3% |
| Koreans | 93.8 /100 | #118 | Exceptional 11.3% |
Demographics Similar to Chickasaw by Disability
In terms of disability, the demographic groups most similar to Chickasaw are Choctaw (15.4%, a difference of 1.5%), Dutch West Indian (14.9%, a difference of 1.8%), Seminole (14.9%, a difference of 2.1%), Cherokee (14.8%, a difference of 2.2%), and Lumbee (15.5%, a difference of 2.3%).
| Demographics | Rating | Rank | Disability |
| Pueblo | 0.0 /100 | #332 | Tragic 14.4% |
| Cajuns | 0.0 /100 | #333 | Tragic 14.6% |
| Yuman | 0.0 /100 | #334 | Tragic 14.6% |
| Tohono O'odham | 0.0 /100 | #335 | Tragic 14.8% |
| Cherokee | 0.0 /100 | #336 | Tragic 14.8% |
| Seminole | 0.0 /100 | #337 | Tragic 14.9% |
| Dutch West Indians | 0.0 /100 | #338 | Tragic 14.9% |
| Chickasaw | 0.0 /100 | #339 | Tragic 15.2% |
| Choctaw | 0.0 /100 | #340 | Tragic 15.4% |
| Lumbee | 0.0 /100 | #341 | Tragic 15.5% |
| Kiowa | 0.0 /100 | #342 | Tragic 15.6% |
| Creek | 0.0 /100 | #343 | Tragic 15.6% |
| Colville | 0.0 /100 | #344 | Tragic 15.8% |
| Puerto Ricans | 0.0 /100 | #345 | Tragic 16.1% |
| Tsimshian | 0.0 /100 | #346 | Tragic 16.1% |