Dominican vs Filipino Disability
COMPARE
Dominican
Filipino
Disability
Disability Comparison
Dominicans
Filipinos
12.7%
DISABILITY
0.0/ 100
METRIC RATING
272nd/ 347
METRIC RANK
9.6%
DISABILITY
100.0/ 100
METRIC RATING
2nd/ 347
METRIC RANK
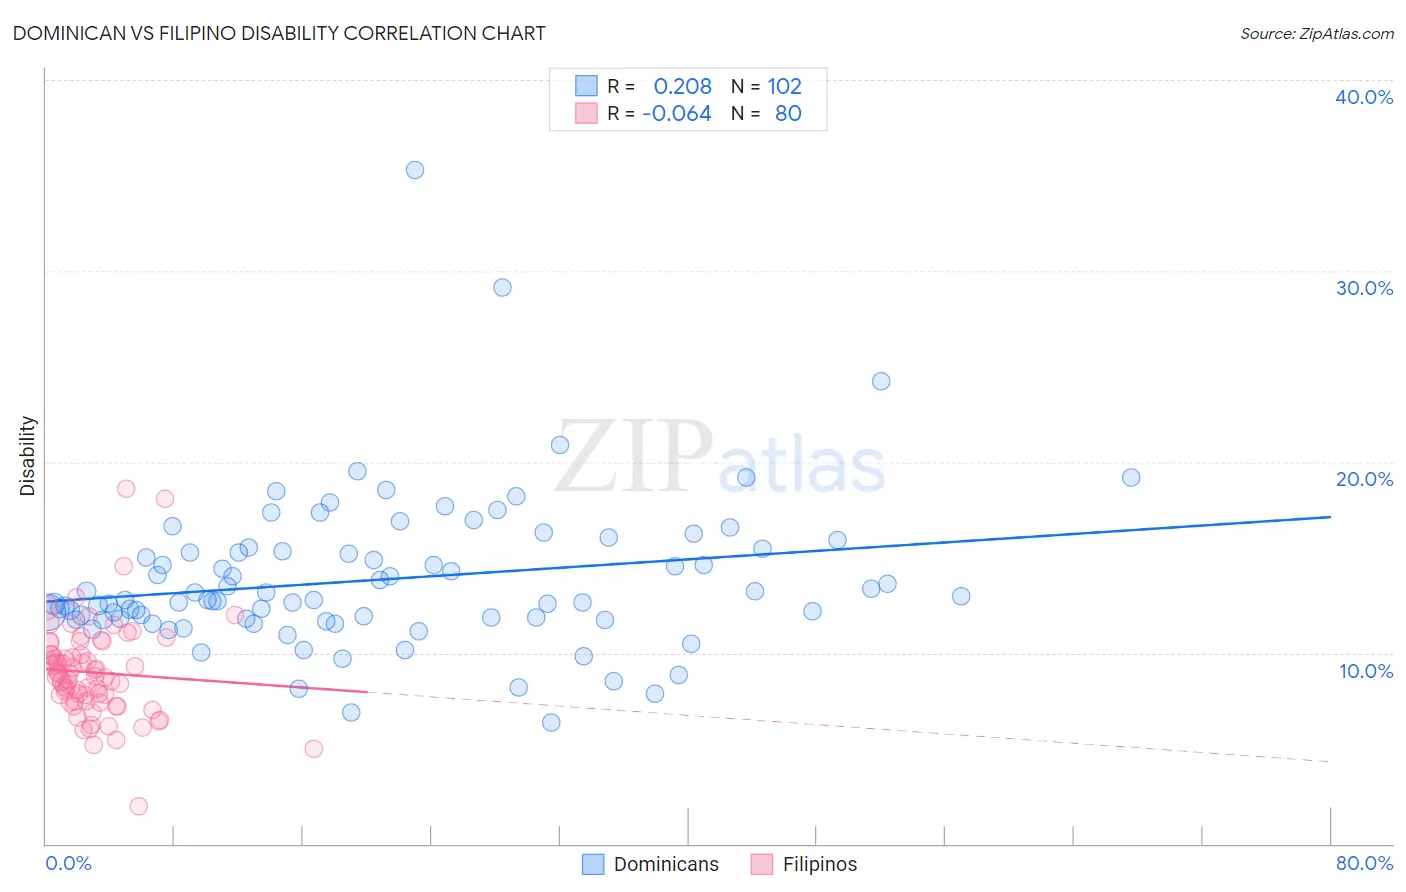
Dominican vs Filipino Disability Correlation Chart
The statistical analysis conducted on geographies consisting of 355,062,868 people shows a weak positive correlation between the proportion of Dominicans and percentage of population with a disability in the United States with a correlation coefficient (R) of 0.208 and weighted average of 12.7%. Similarly, the statistical analysis conducted on geographies consisting of 254,346,724 people shows a slight negative correlation between the proportion of Filipinos and percentage of population with a disability in the United States with a correlation coefficient (R) of -0.064 and weighted average of 9.6%, a difference of 32.3%.
Disability Correlation Summary
| Measurement | Dominican | Filipino |
| Minimum | 6.4% | 2.0% |
| Maximum | 35.3% | 18.6% |
| Range | 28.9% | 16.6% |
| Mean | 13.8% | 9.0% |
| Median | 12.8% | 8.7% |
| Interquartile 25% (IQ1) | 11.8% | 7.5% |
| Interquartile 75% (IQ3) | 15.3% | 9.9% |
| Interquartile Range (IQR) | 3.5% | 2.5% |
| Standard Deviation (Sample) | 4.0% | 2.5% |
| Standard Deviation (Population) | 4.0% | 2.5% |
Similar Demographics by Disability
Demographics Similar to Dominicans by Disability
In terms of disability, the demographic groups most similar to Dominicans are Finnish (12.7%, a difference of 0.16%), Immigrants from Yemen (12.6%, a difference of 0.49%), Portuguese (12.6%, a difference of 0.54%), Nepalese (12.8%, a difference of 0.60%), and Sioux (12.8%, a difference of 0.68%).
| Demographics | Rating | Rank | Disability |
| U.S. Virgin Islanders | 0.2 /100 | #265 | Tragic 12.5% |
| Czechoslovakians | 0.2 /100 | #266 | Tragic 12.5% |
| Spaniards | 0.2 /100 | #267 | Tragic 12.5% |
| Bangladeshis | 0.1 /100 | #268 | Tragic 12.6% |
| Immigrants | Dominican Republic | 0.1 /100 | #269 | Tragic 12.6% |
| Portuguese | 0.1 /100 | #270 | Tragic 12.6% |
| Immigrants | Yemen | 0.1 /100 | #271 | Tragic 12.6% |
| Dominicans | 0.0 /100 | #272 | Tragic 12.7% |
| Finns | 0.0 /100 | #273 | Tragic 12.7% |
| Nepalese | 0.0 /100 | #274 | Tragic 12.8% |
| Sioux | 0.0 /100 | #275 | Tragic 12.8% |
| Hmong | 0.0 /100 | #276 | Tragic 12.8% |
| Dutch | 0.0 /100 | #277 | Tragic 12.8% |
| Germans | 0.0 /100 | #278 | Tragic 12.8% |
| Fijians | 0.0 /100 | #279 | Tragic 12.8% |
Demographics Similar to Filipinos by Disability
In terms of disability, the demographic groups most similar to Filipinos are Immigrants from Taiwan (9.6%, a difference of 0.080%), Immigrants from India (9.5%, a difference of 0.98%), Thai (9.7%, a difference of 1.1%), Immigrants from Bolivia (9.9%, a difference of 2.8%), and Immigrants from South Central Asia (9.9%, a difference of 3.7%).
| Demographics | Rating | Rank | Disability |
| Immigrants | India | 100.0 /100 | #1 | Exceptional 9.5% |
| Filipinos | 100.0 /100 | #2 | Exceptional 9.6% |
| Immigrants | Taiwan | 100.0 /100 | #3 | Exceptional 9.6% |
| Thais | 100.0 /100 | #4 | Exceptional 9.7% |
| Immigrants | Bolivia | 100.0 /100 | #5 | Exceptional 9.9% |
| Immigrants | South Central Asia | 100.0 /100 | #6 | Exceptional 9.9% |
| Immigrants | Singapore | 100.0 /100 | #7 | Exceptional 10.0% |
| Bolivians | 100.0 /100 | #8 | Exceptional 10.0% |
| Immigrants | Hong Kong | 100.0 /100 | #9 | Exceptional 10.0% |
| Immigrants | China | 100.0 /100 | #10 | Exceptional 10.1% |
| Iranians | 100.0 /100 | #11 | Exceptional 10.1% |
| Immigrants | Israel | 100.0 /100 | #12 | Exceptional 10.1% |
| Immigrants | Eastern Asia | 100.0 /100 | #13 | Exceptional 10.2% |
| Immigrants | Korea | 100.0 /100 | #14 | Exceptional 10.2% |
| Okinawans | 100.0 /100 | #15 | Exceptional 10.3% |