Dominican vs Central American Indian Disability
COMPARE
Dominican
Central American Indian
Disability
Disability Comparison
Dominicans
Central American Indians
12.7%
DISABILITY
0.0/ 100
METRIC RATING
272nd/ 347
METRIC RANK
13.2%
DISABILITY
0.0/ 100
METRIC RATING
296th/ 347
METRIC RANK
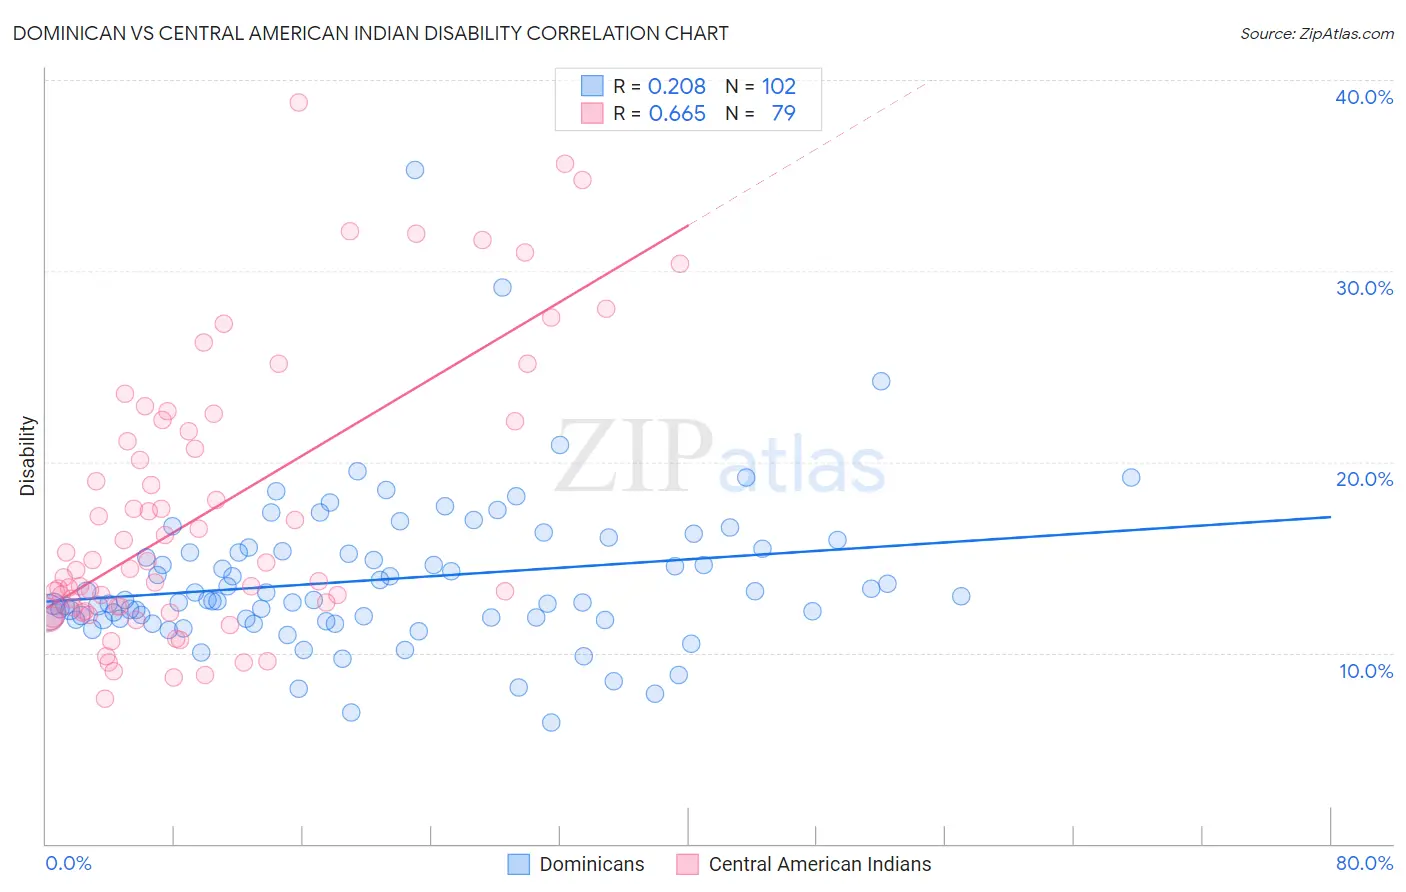
Dominican vs Central American Indian Disability Correlation Chart
The statistical analysis conducted on geographies consisting of 355,062,868 people shows a weak positive correlation between the proportion of Dominicans and percentage of population with a disability in the United States with a correlation coefficient (R) of 0.208 and weighted average of 12.7%. Similarly, the statistical analysis conducted on geographies consisting of 326,115,118 people shows a significant positive correlation between the proportion of Central American Indians and percentage of population with a disability in the United States with a correlation coefficient (R) of 0.665 and weighted average of 13.2%, a difference of 3.7%.
Disability Correlation Summary
| Measurement | Dominican | Central American Indian |
| Minimum | 6.4% | 7.6% |
| Maximum | 35.3% | 38.8% |
| Range | 28.9% | 31.2% |
| Mean | 13.8% | 17.4% |
| Median | 12.8% | 14.4% |
| Interquartile 25% (IQ1) | 11.8% | 12.2% |
| Interquartile 75% (IQ3) | 15.3% | 22.1% |
| Interquartile Range (IQR) | 3.5% | 9.9% |
| Standard Deviation (Sample) | 4.0% | 7.3% |
| Standard Deviation (Population) | 4.0% | 7.3% |
Similar Demographics by Disability
Demographics Similar to Dominicans by Disability
In terms of disability, the demographic groups most similar to Dominicans are Finnish (12.7%, a difference of 0.16%), Immigrants from Yemen (12.6%, a difference of 0.49%), Portuguese (12.6%, a difference of 0.54%), Nepalese (12.8%, a difference of 0.60%), and Sioux (12.8%, a difference of 0.68%).
| Demographics | Rating | Rank | Disability |
| U.S. Virgin Islanders | 0.2 /100 | #265 | Tragic 12.5% |
| Czechoslovakians | 0.2 /100 | #266 | Tragic 12.5% |
| Spaniards | 0.2 /100 | #267 | Tragic 12.5% |
| Bangladeshis | 0.1 /100 | #268 | Tragic 12.6% |
| Immigrants | Dominican Republic | 0.1 /100 | #269 | Tragic 12.6% |
| Portuguese | 0.1 /100 | #270 | Tragic 12.6% |
| Immigrants | Yemen | 0.1 /100 | #271 | Tragic 12.6% |
| Dominicans | 0.0 /100 | #272 | Tragic 12.7% |
| Finns | 0.0 /100 | #273 | Tragic 12.7% |
| Nepalese | 0.0 /100 | #274 | Tragic 12.8% |
| Sioux | 0.0 /100 | #275 | Tragic 12.8% |
| Hmong | 0.0 /100 | #276 | Tragic 12.8% |
| Dutch | 0.0 /100 | #277 | Tragic 12.8% |
| Germans | 0.0 /100 | #278 | Tragic 12.8% |
| Fijians | 0.0 /100 | #279 | Tragic 12.8% |
Demographics Similar to Central American Indians by Disability
In terms of disability, the demographic groups most similar to Central American Indians are Nonimmigrants (13.2%, a difference of 0.040%), Hopi (13.2%, a difference of 0.060%), Alaska Native (13.2%, a difference of 0.070%), French (13.2%, a difference of 0.080%), and Pennsylvania German (13.2%, a difference of 0.13%).
| Demographics | Rating | Rank | Disability |
| Slovaks | 0.0 /100 | #289 | Tragic 13.0% |
| Cheyenne | 0.0 /100 | #290 | Tragic 13.0% |
| Yaqui | 0.0 /100 | #291 | Tragic 13.1% |
| Aleuts | 0.0 /100 | #292 | Tragic 13.1% |
| Marshallese | 0.0 /100 | #293 | Tragic 13.1% |
| Celtics | 0.0 /100 | #294 | Tragic 13.1% |
| Immigrants | Nonimmigrants | 0.0 /100 | #295 | Tragic 13.2% |
| Central American Indians | 0.0 /100 | #296 | Tragic 13.2% |
| Hopi | 0.0 /100 | #297 | Tragic 13.2% |
| Alaska Natives | 0.0 /100 | #298 | Tragic 13.2% |
| French | 0.0 /100 | #299 | Tragic 13.2% |
| Pennsylvania Germans | 0.0 /100 | #300 | Tragic 13.2% |
| Immigrants | Micronesia | 0.0 /100 | #301 | Tragic 13.2% |
| Arapaho | 0.0 /100 | #302 | Tragic 13.2% |
| Scotch-Irish | 0.0 /100 | #303 | Tragic 13.3% |