Canadian vs Lumbee Male Disability
COMPARE
Canadian
Lumbee
Male Disability
Male Disability Comparison
Canadians
Lumbee
12.2%
MALE DISABILITY
0.2/ 100
METRIC RATING
263rd/ 347
METRIC RANK
15.2%
MALE DISABILITY
0.0/ 100
METRIC RATING
340th/ 347
METRIC RANK
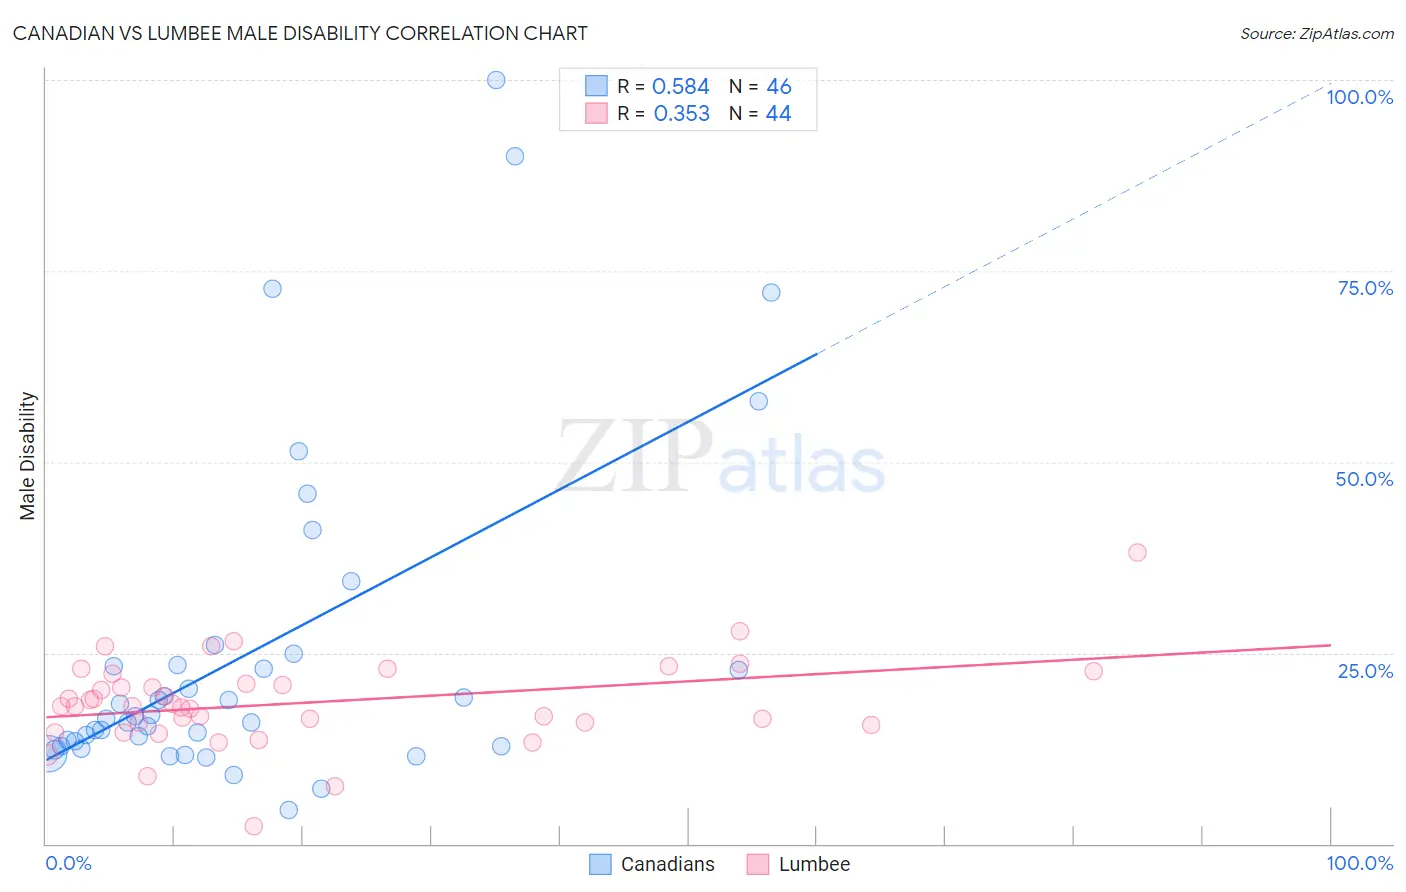
Canadian vs Lumbee Male Disability Correlation Chart
The statistical analysis conducted on geographies consisting of 437,467,484 people shows a substantial positive correlation between the proportion of Canadians and percentage of males with a disability in the United States with a correlation coefficient (R) of 0.584 and weighted average of 12.2%. Similarly, the statistical analysis conducted on geographies consisting of 92,279,145 people shows a mild positive correlation between the proportion of Lumbee and percentage of males with a disability in the United States with a correlation coefficient (R) of 0.353 and weighted average of 15.2%, a difference of 24.8%.
Male Disability Correlation Summary
| Measurement | Canadian | Lumbee |
| Minimum | 4.4% | 2.2% |
| Maximum | 100.0% | 38.1% |
| Range | 95.6% | 35.8% |
| Mean | 25.0% | 18.5% |
| Median | 16.5% | 18.0% |
| Interquartile 25% (IQ1) | 12.7% | 15.7% |
| Interquartile 75% (IQ3) | 23.4% | 21.6% |
| Interquartile Range (IQR) | 10.7% | 6.0% |
| Standard Deviation (Sample) | 21.6% | 5.9% |
| Standard Deviation (Population) | 21.3% | 5.8% |
Similar Demographics by Male Disability
Demographics Similar to Canadians by Male Disability
In terms of male disability, the demographic groups most similar to Canadians are Nepalese (12.2%, a difference of 0.030%), Norwegian (12.2%, a difference of 0.20%), Slavic (12.2%, a difference of 0.21%), Immigrants from Portugal (12.3%, a difference of 0.49%), and Hawaiian (12.3%, a difference of 0.51%).
| Demographics | Rating | Rank | Male Disability |
| Swiss | 0.3 /100 | #256 | Tragic 12.1% |
| Europeans | 0.3 /100 | #257 | Tragic 12.1% |
| Basques | 0.3 /100 | #258 | Tragic 12.1% |
| Belgians | 0.3 /100 | #259 | Tragic 12.1% |
| Swedes | 0.3 /100 | #260 | Tragic 12.1% |
| Slavs | 0.2 /100 | #261 | Tragic 12.2% |
| Norwegians | 0.2 /100 | #262 | Tragic 12.2% |
| Canadians | 0.2 /100 | #263 | Tragic 12.2% |
| Nepalese | 0.2 /100 | #264 | Tragic 12.2% |
| Immigrants | Portugal | 0.1 /100 | #265 | Tragic 12.3% |
| Hawaiians | 0.1 /100 | #266 | Tragic 12.3% |
| Immigrants | Germany | 0.1 /100 | #267 | Tragic 12.3% |
| Portuguese | 0.1 /100 | #268 | Tragic 12.3% |
| Czechoslovakians | 0.1 /100 | #269 | Tragic 12.3% |
| Spaniards | 0.1 /100 | #270 | Tragic 12.3% |
Demographics Similar to Lumbee by Male Disability
In terms of male disability, the demographic groups most similar to Lumbee are Chickasaw (15.1%, a difference of 0.74%), Choctaw (15.4%, a difference of 1.1%), Kiowa (15.4%, a difference of 1.3%), Pueblo (15.0%, a difference of 1.5%), and Menominee (15.0%, a difference of 1.7%).
| Demographics | Rating | Rank | Male Disability |
| Yuman | 0.0 /100 | #333 | Tragic 14.7% |
| Cherokee | 0.0 /100 | #334 | Tragic 14.8% |
| Dutch West Indians | 0.0 /100 | #335 | Tragic 14.8% |
| Alaskan Athabascans | 0.0 /100 | #336 | Tragic 14.9% |
| Menominee | 0.0 /100 | #337 | Tragic 15.0% |
| Pueblo | 0.0 /100 | #338 | Tragic 15.0% |
| Chickasaw | 0.0 /100 | #339 | Tragic 15.1% |
| Lumbee | 0.0 /100 | #340 | Tragic 15.2% |
| Choctaw | 0.0 /100 | #341 | Tragic 15.4% |
| Kiowa | 0.0 /100 | #342 | Tragic 15.4% |
| Creek | 0.0 /100 | #343 | Tragic 15.5% |
| Puerto Ricans | 0.0 /100 | #344 | Tragic 15.6% |
| Tsimshian | 0.0 /100 | #345 | Tragic 15.6% |
| Colville | 0.0 /100 | #346 | Tragic 16.5% |
| Houma | 0.0 /100 | #347 | Tragic 17.4% |