Canadian vs Lumbee Family Households
COMPARE
Canadian
Lumbee
Family Households
Family Households Comparison
Canadians
Lumbee
64.4%
FAMILY HOUSEHOLDS
66.6/ 100
METRIC RATING
157th/ 347
METRIC RANK
63.1%
FAMILY HOUSEHOLDS
0.3/ 100
METRIC RATING
274th/ 347
METRIC RANK
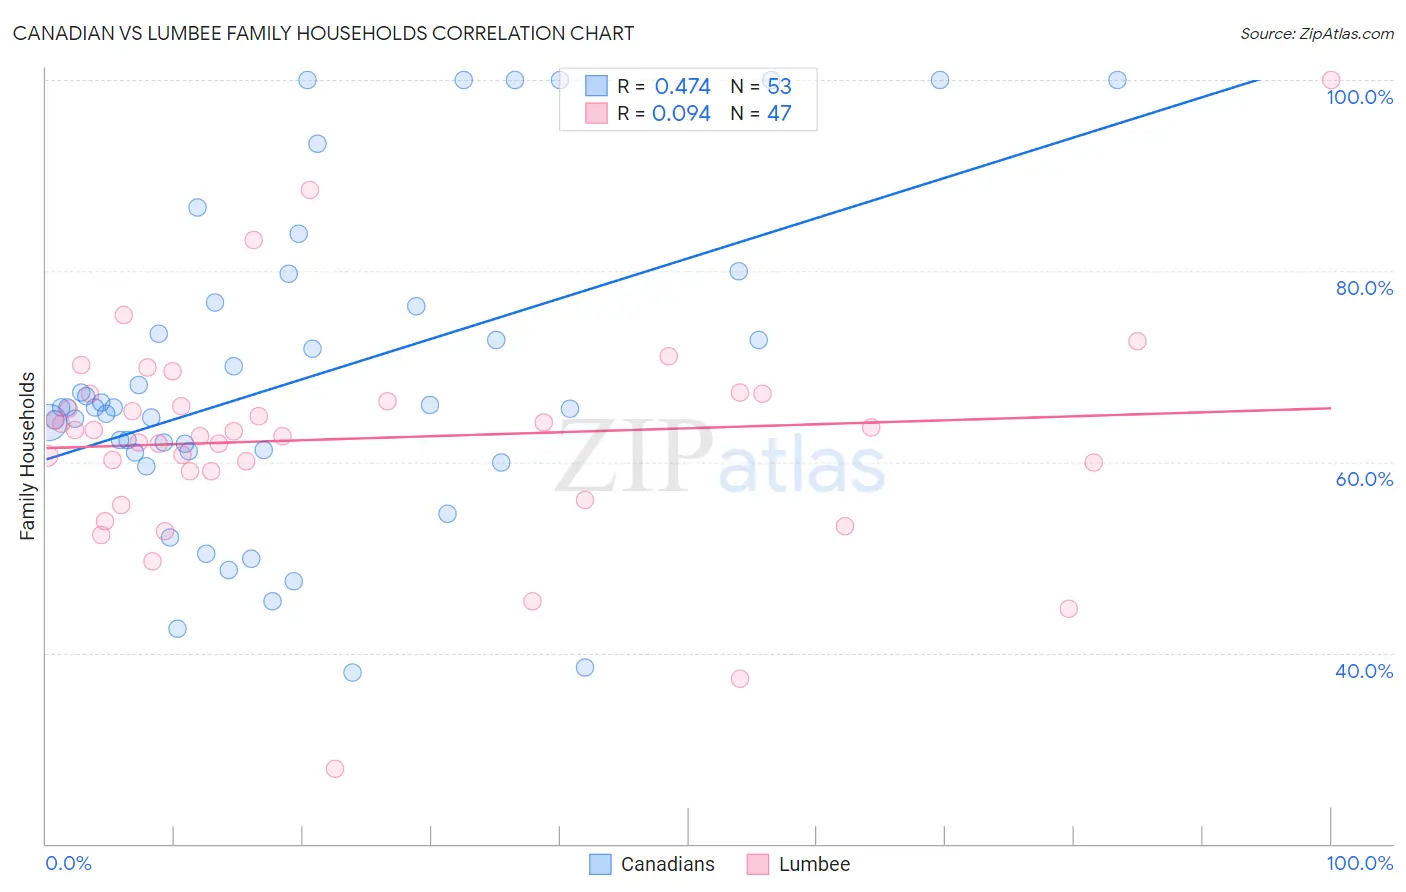
Canadian vs Lumbee Family Households Correlation Chart
The statistical analysis conducted on geographies consisting of 437,288,954 people shows a moderate positive correlation between the proportion of Canadians and percentage of family households in the United States with a correlation coefficient (R) of 0.474 and weighted average of 64.4%. Similarly, the statistical analysis conducted on geographies consisting of 92,265,071 people shows a slight positive correlation between the proportion of Lumbee and percentage of family households in the United States with a correlation coefficient (R) of 0.094 and weighted average of 63.1%, a difference of 2.2%.
Family Households Correlation Summary
| Measurement | Canadian | Lumbee |
| Minimum | 38.0% | 27.9% |
| Maximum | 100.0% | 100.0% |
| Range | 62.0% | 72.1% |
| Mean | 68.7% | 62.4% |
| Median | 65.6% | 63.1% |
| Interquartile 25% (IQ1) | 61.0% | 59.0% |
| Interquartile 75% (IQ3) | 76.5% | 67.2% |
| Interquartile Range (IQR) | 15.5% | 8.2% |
| Standard Deviation (Sample) | 16.5% | 11.7% |
| Standard Deviation (Population) | 16.4% | 11.5% |
Similar Demographics by Family Households
Demographics Similar to Canadians by Family Households
In terms of family households, the demographic groups most similar to Canadians are Lebanese (64.4%, a difference of 0.0%), Czech (64.5%, a difference of 0.010%), German (64.4%, a difference of 0.010%), Uruguayan (64.5%, a difference of 0.020%), and Immigrants from Moldova (64.4%, a difference of 0.020%).
| Demographics | Rating | Rank | Family Households |
| Romanians | 75.3 /100 | #150 | Good 64.5% |
| Syrians | 75.2 /100 | #151 | Good 64.5% |
| Scottish | 70.9 /100 | #152 | Good 64.5% |
| Swedes | 69.8 /100 | #153 | Good 64.5% |
| Austrians | 68.5 /100 | #154 | Good 64.5% |
| Uruguayans | 67.7 /100 | #155 | Good 64.5% |
| Czechs | 67.0 /100 | #156 | Good 64.5% |
| Canadians | 66.6 /100 | #157 | Good 64.4% |
| Lebanese | 66.4 /100 | #158 | Good 64.4% |
| Germans | 65.8 /100 | #159 | Good 64.4% |
| Immigrants | Moldova | 65.2 /100 | #160 | Good 64.4% |
| Immigrants | England | 62.6 /100 | #161 | Good 64.4% |
| British | 61.6 /100 | #162 | Good 64.4% |
| Chickasaw | 61.5 /100 | #163 | Good 64.4% |
| Immigrants | Nigeria | 60.1 /100 | #164 | Good 64.4% |
Demographics Similar to Lumbee by Family Households
In terms of family households, the demographic groups most similar to Lumbee are West Indian (63.1%, a difference of 0.0%), Immigrants from Kazakhstan (63.1%, a difference of 0.010%), Serbian (63.0%, a difference of 0.010%), Immigrants from Croatia (63.1%, a difference of 0.020%), and Immigrants from Turkey (63.1%, a difference of 0.020%).
| Demographics | Rating | Rank | Family Households |
| Israelis | 0.4 /100 | #267 | Tragic 63.1% |
| Immigrants | Singapore | 0.4 /100 | #268 | Tragic 63.1% |
| Yugoslavians | 0.4 /100 | #269 | Tragic 63.1% |
| Immigrants | Austria | 0.3 /100 | #270 | Tragic 63.1% |
| Immigrants | Croatia | 0.3 /100 | #271 | Tragic 63.1% |
| Immigrants | Turkey | 0.3 /100 | #272 | Tragic 63.1% |
| Immigrants | Kazakhstan | 0.3 /100 | #273 | Tragic 63.1% |
| Lumbee | 0.3 /100 | #274 | Tragic 63.1% |
| West Indians | 0.3 /100 | #275 | Tragic 63.1% |
| Serbians | 0.3 /100 | #276 | Tragic 63.0% |
| Ottawa | 0.3 /100 | #277 | Tragic 63.0% |
| Immigrants | Belgium | 0.2 /100 | #278 | Tragic 63.0% |
| Immigrants | Yemen | 0.2 /100 | #279 | Tragic 63.0% |
| Immigrants | Bulgaria | 0.2 /100 | #280 | Tragic 63.0% |
| Estonians | 0.2 /100 | #281 | Tragic 62.9% |