Uruguayan vs Lumbee Male Disability
COMPARE
Uruguayan
Lumbee
Male Disability
Male Disability Comparison
Uruguayans
Lumbee
10.7%
MALE DISABILITY
95.3/ 100
METRIC RATING
103rd/ 347
METRIC RANK
15.2%
MALE DISABILITY
0.0/ 100
METRIC RATING
340th/ 347
METRIC RANK
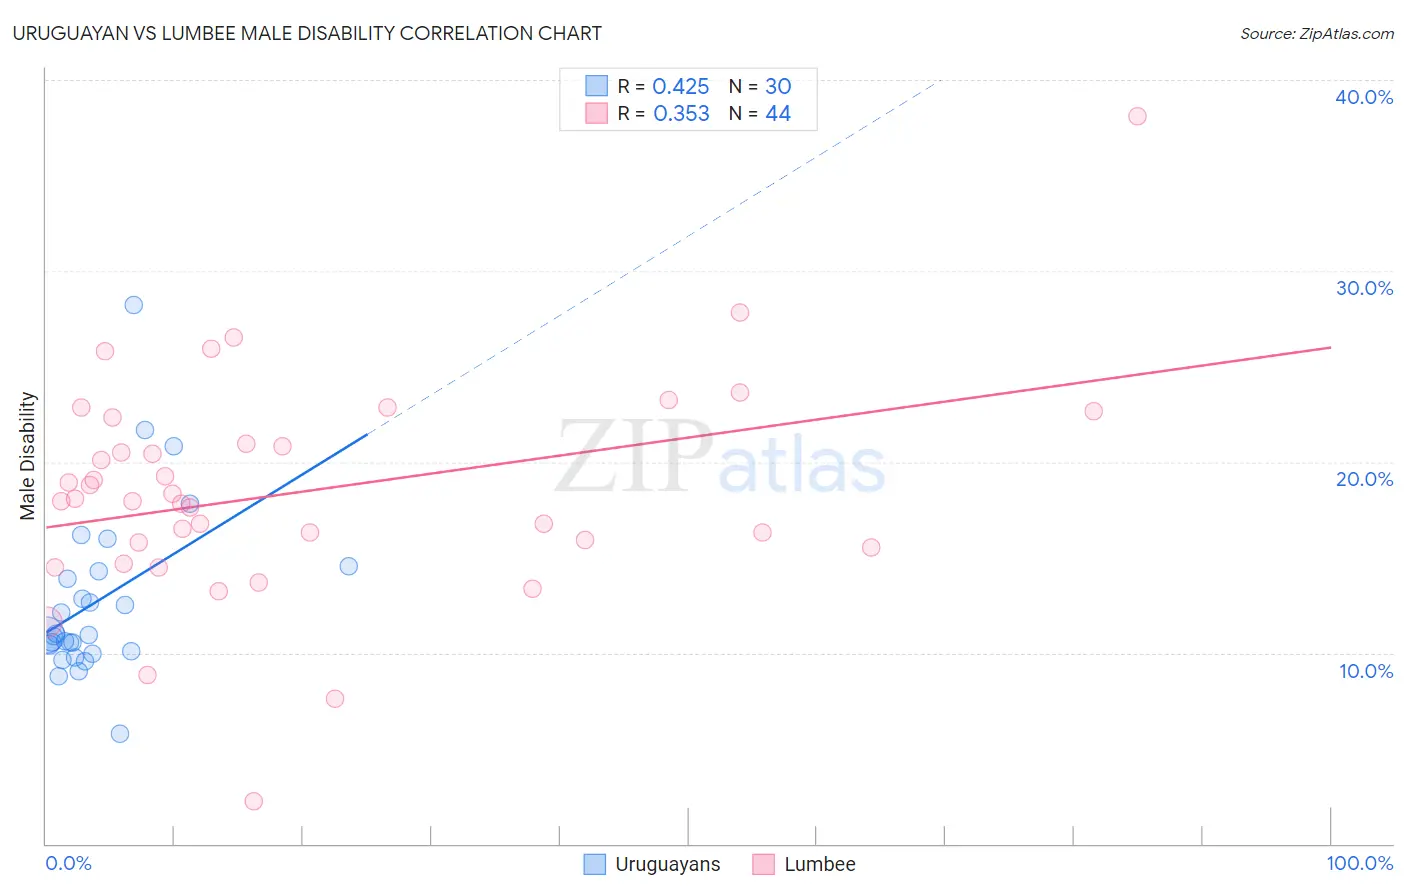
Uruguayan vs Lumbee Male Disability Correlation Chart
The statistical analysis conducted on geographies consisting of 144,784,300 people shows a moderate positive correlation between the proportion of Uruguayans and percentage of males with a disability in the United States with a correlation coefficient (R) of 0.425 and weighted average of 10.7%. Similarly, the statistical analysis conducted on geographies consisting of 92,279,145 people shows a mild positive correlation between the proportion of Lumbee and percentage of males with a disability in the United States with a correlation coefficient (R) of 0.353 and weighted average of 15.2%, a difference of 41.7%.
Male Disability Correlation Summary
| Measurement | Uruguayan | Lumbee |
| Minimum | 5.8% | 2.2% |
| Maximum | 28.2% | 38.1% |
| Range | 22.4% | 35.8% |
| Mean | 12.7% | 18.5% |
| Median | 10.9% | 18.0% |
| Interquartile 25% (IQ1) | 10.1% | 15.7% |
| Interquartile 75% (IQ3) | 14.3% | 21.6% |
| Interquartile Range (IQR) | 4.2% | 6.0% |
| Standard Deviation (Sample) | 4.5% | 5.9% |
| Standard Deviation (Population) | 4.5% | 5.8% |
Similar Demographics by Male Disability
Demographics Similar to Uruguayans by Male Disability
In terms of male disability, the demographic groups most similar to Uruguayans are Immigrants from Eastern Europe (10.7%, a difference of 0.010%), Immigrants from Nigeria (10.8%, a difference of 0.060%), Immigrants from Brazil (10.8%, a difference of 0.080%), Immigrants from Greece (10.7%, a difference of 0.11%), and Immigrants from Syria (10.8%, a difference of 0.12%).
| Demographics | Rating | Rank | Male Disability |
| Nicaraguans | 96.6 /100 | #96 | Exceptional 10.7% |
| Immigrants | Armenia | 96.6 /100 | #97 | Exceptional 10.7% |
| Immigrants | Romania | 96.5 /100 | #98 | Exceptional 10.7% |
| Immigrants | Switzerland | 96.1 /100 | #99 | Exceptional 10.7% |
| Immigrants | Kazakhstan | 95.9 /100 | #100 | Exceptional 10.7% |
| Immigrants | Greece | 95.6 /100 | #101 | Exceptional 10.7% |
| Immigrants | Eastern Europe | 95.3 /100 | #102 | Exceptional 10.7% |
| Uruguayans | 95.3 /100 | #103 | Exceptional 10.7% |
| Immigrants | Nigeria | 95.1 /100 | #104 | Exceptional 10.8% |
| Immigrants | Brazil | 95.0 /100 | #105 | Exceptional 10.8% |
| Immigrants | Syria | 94.9 /100 | #106 | Exceptional 10.8% |
| Immigrants | Eastern Africa | 94.3 /100 | #107 | Exceptional 10.8% |
| Immigrants | Belgium | 94.2 /100 | #108 | Exceptional 10.8% |
| Immigrants | Uganda | 94.0 /100 | #109 | Exceptional 10.8% |
| Immigrants | Immigrants | 93.9 /100 | #110 | Exceptional 10.8% |
Demographics Similar to Lumbee by Male Disability
In terms of male disability, the demographic groups most similar to Lumbee are Chickasaw (15.1%, a difference of 0.74%), Choctaw (15.4%, a difference of 1.1%), Kiowa (15.4%, a difference of 1.3%), Pueblo (15.0%, a difference of 1.5%), and Menominee (15.0%, a difference of 1.7%).
| Demographics | Rating | Rank | Male Disability |
| Yuman | 0.0 /100 | #333 | Tragic 14.7% |
| Cherokee | 0.0 /100 | #334 | Tragic 14.8% |
| Dutch West Indians | 0.0 /100 | #335 | Tragic 14.8% |
| Alaskan Athabascans | 0.0 /100 | #336 | Tragic 14.9% |
| Menominee | 0.0 /100 | #337 | Tragic 15.0% |
| Pueblo | 0.0 /100 | #338 | Tragic 15.0% |
| Chickasaw | 0.0 /100 | #339 | Tragic 15.1% |
| Lumbee | 0.0 /100 | #340 | Tragic 15.2% |
| Choctaw | 0.0 /100 | #341 | Tragic 15.4% |
| Kiowa | 0.0 /100 | #342 | Tragic 15.4% |
| Creek | 0.0 /100 | #343 | Tragic 15.5% |
| Puerto Ricans | 0.0 /100 | #344 | Tragic 15.6% |
| Tsimshian | 0.0 /100 | #345 | Tragic 15.6% |
| Colville | 0.0 /100 | #346 | Tragic 16.5% |
| Houma | 0.0 /100 | #347 | Tragic 17.4% |