Lebanese vs Lumbee Male Disability
COMPARE
Lebanese
Lumbee
Male Disability
Male Disability Comparison
Lebanese
Lumbee
11.5%
MALE DISABILITY
15.4/ 100
METRIC RATING
199th/ 347
METRIC RANK
15.2%
MALE DISABILITY
0.0/ 100
METRIC RATING
340th/ 347
METRIC RANK
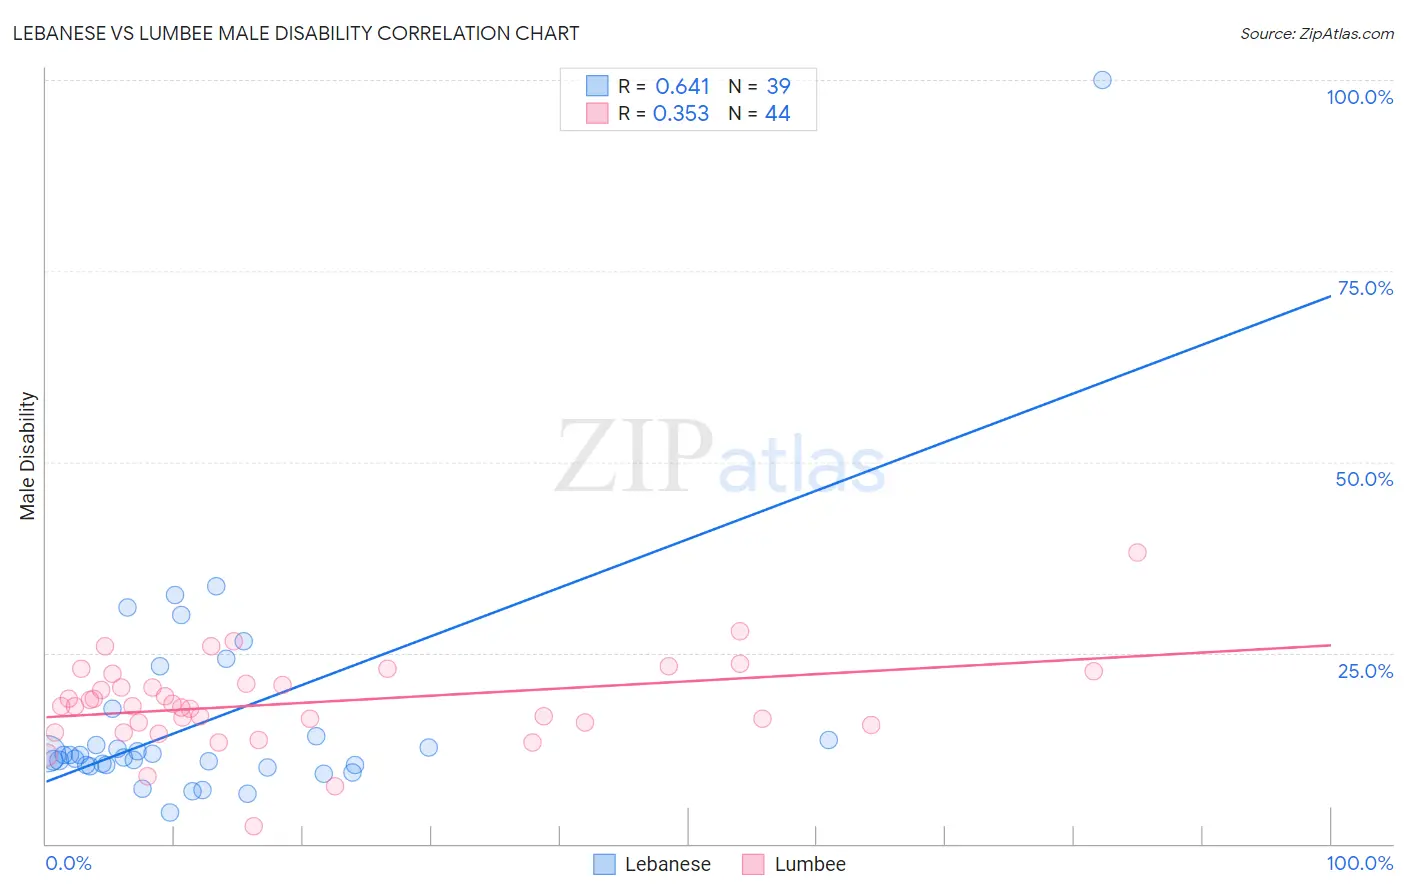
Lebanese vs Lumbee Male Disability Correlation Chart
The statistical analysis conducted on geographies consisting of 401,575,974 people shows a significant positive correlation between the proportion of Lebanese and percentage of males with a disability in the United States with a correlation coefficient (R) of 0.641 and weighted average of 11.5%. Similarly, the statistical analysis conducted on geographies consisting of 92,279,145 people shows a mild positive correlation between the proportion of Lumbee and percentage of males with a disability in the United States with a correlation coefficient (R) of 0.353 and weighted average of 15.2%, a difference of 32.7%.
Male Disability Correlation Summary
| Measurement | Lebanese | Lumbee |
| Minimum | 4.0% | 2.2% |
| Maximum | 100.0% | 38.1% |
| Range | 96.0% | 35.8% |
| Mean | 16.2% | 18.5% |
| Median | 11.6% | 18.0% |
| Interquartile 25% (IQ1) | 10.2% | 15.7% |
| Interquartile 75% (IQ3) | 14.1% | 21.6% |
| Interquartile Range (IQR) | 3.9% | 6.0% |
| Standard Deviation (Sample) | 15.7% | 5.9% |
| Standard Deviation (Population) | 15.5% | 5.8% |
Similar Demographics by Male Disability
Demographics Similar to Lebanese by Male Disability
In terms of male disability, the demographic groups most similar to Lebanese are Immigrants from Jamaica (11.5%, a difference of 0.090%), Somali (11.4%, a difference of 0.27%), Immigrants from Iraq (11.5%, a difference of 0.27%), Immigrants from Panama (11.5%, a difference of 0.27%), and West Indian (11.4%, a difference of 0.29%).
| Demographics | Rating | Rank | Male Disability |
| Assyrians/Chaldeans/Syriacs | 23.2 /100 | #192 | Fair 11.4% |
| Greeks | 22.2 /100 | #193 | Fair 11.4% |
| Belizeans | 21.2 /100 | #194 | Fair 11.4% |
| Immigrants | Oceania | 20.9 /100 | #195 | Fair 11.4% |
| West Indians | 18.4 /100 | #196 | Poor 11.4% |
| Somalis | 18.2 /100 | #197 | Poor 11.4% |
| Immigrants | Jamaica | 16.3 /100 | #198 | Poor 11.5% |
| Lebanese | 15.4 /100 | #199 | Poor 11.5% |
| Immigrants | Iraq | 13.0 /100 | #200 | Poor 11.5% |
| Immigrants | Panama | 13.0 /100 | #201 | Poor 11.5% |
| Immigrants | Mexico | 12.6 /100 | #202 | Poor 11.5% |
| Jamaicans | 10.9 /100 | #203 | Poor 11.5% |
| Immigrants | Cambodia | 10.8 /100 | #204 | Poor 11.5% |
| Serbians | 10.7 /100 | #205 | Poor 11.5% |
| Ukrainians | 10.6 /100 | #206 | Poor 11.5% |
Demographics Similar to Lumbee by Male Disability
In terms of male disability, the demographic groups most similar to Lumbee are Chickasaw (15.1%, a difference of 0.74%), Choctaw (15.4%, a difference of 1.1%), Kiowa (15.4%, a difference of 1.3%), Pueblo (15.0%, a difference of 1.5%), and Menominee (15.0%, a difference of 1.7%).
| Demographics | Rating | Rank | Male Disability |
| Yuman | 0.0 /100 | #333 | Tragic 14.7% |
| Cherokee | 0.0 /100 | #334 | Tragic 14.8% |
| Dutch West Indians | 0.0 /100 | #335 | Tragic 14.8% |
| Alaskan Athabascans | 0.0 /100 | #336 | Tragic 14.9% |
| Menominee | 0.0 /100 | #337 | Tragic 15.0% |
| Pueblo | 0.0 /100 | #338 | Tragic 15.0% |
| Chickasaw | 0.0 /100 | #339 | Tragic 15.1% |
| Lumbee | 0.0 /100 | #340 | Tragic 15.2% |
| Choctaw | 0.0 /100 | #341 | Tragic 15.4% |
| Kiowa | 0.0 /100 | #342 | Tragic 15.4% |
| Creek | 0.0 /100 | #343 | Tragic 15.5% |
| Puerto Ricans | 0.0 /100 | #344 | Tragic 15.6% |
| Tsimshian | 0.0 /100 | #345 | Tragic 15.6% |
| Colville | 0.0 /100 | #346 | Tragic 16.5% |
| Houma | 0.0 /100 | #347 | Tragic 17.4% |