Canadian vs Lumbee Family Poverty
COMPARE
Canadian
Lumbee
Family Poverty
Family Poverty Comparison
Canadians
Lumbee
8.2%
FAMILY POVERTY
94.2/ 100
METRIC RATING
113th/ 347
METRIC RANK
17.0%
FAMILY POVERTY
0.0/ 100
METRIC RATING
341st/ 347
METRIC RANK
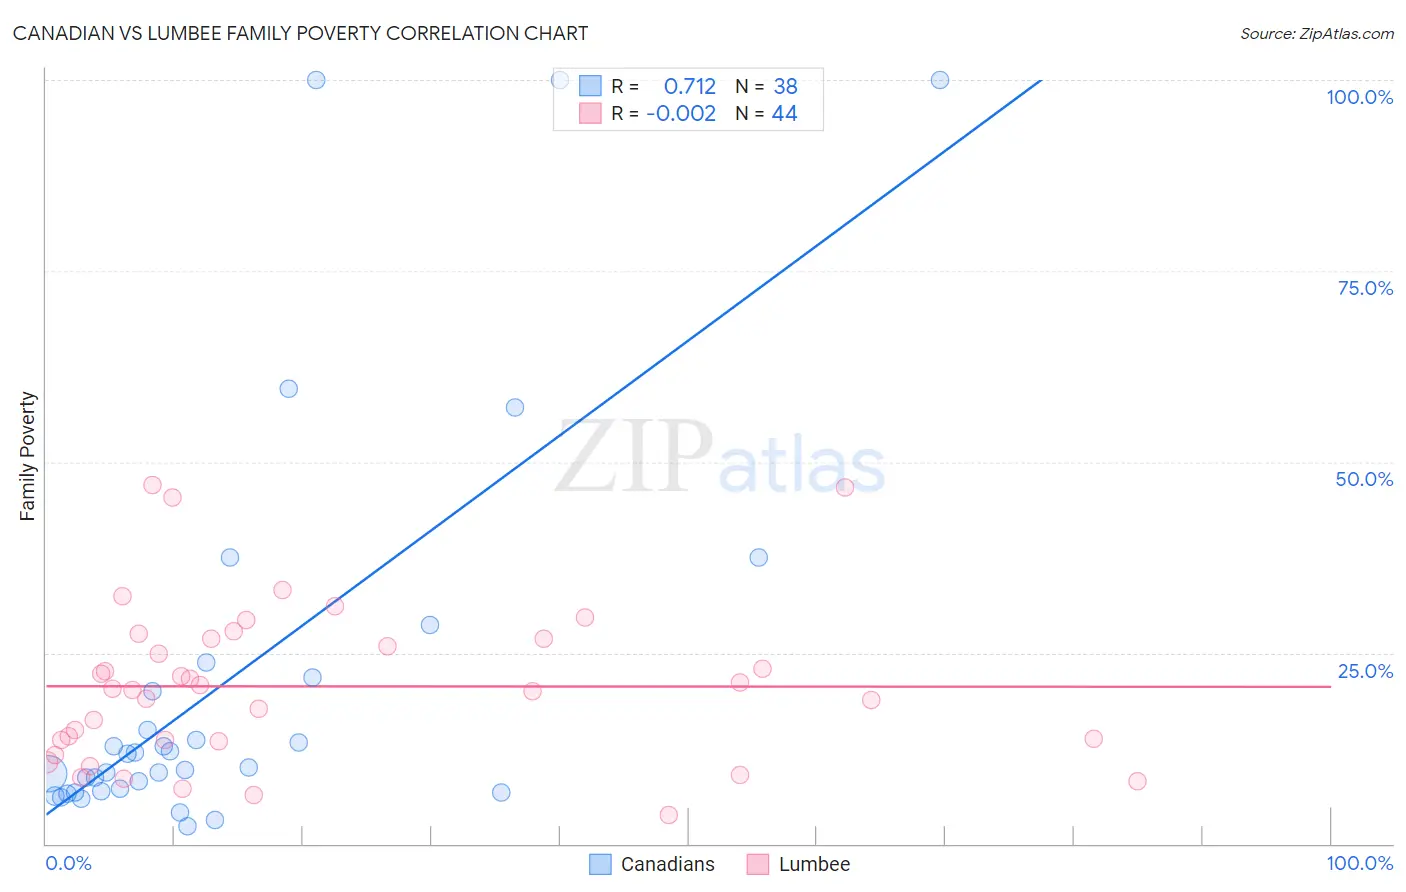
Canadian vs Lumbee Family Poverty Correlation Chart
The statistical analysis conducted on geographies consisting of 435,772,566 people shows a strong positive correlation between the proportion of Canadians and poverty level among families in the United States with a correlation coefficient (R) of 0.712 and weighted average of 8.2%. Similarly, the statistical analysis conducted on geographies consisting of 92,238,507 people shows no correlation between the proportion of Lumbee and poverty level among families in the United States with a correlation coefficient (R) of -0.002 and weighted average of 17.0%, a difference of 107.6%.
Family Poverty Correlation Summary
| Measurement | Canadian | Lumbee |
| Minimum | 2.3% | 3.7% |
| Maximum | 100.0% | 47.0% |
| Range | 97.7% | 43.3% |
| Mean | 21.7% | 20.6% |
| Median | 10.9% | 20.2% |
| Interquartile 25% (IQ1) | 6.9% | 13.5% |
| Interquartile 75% (IQ3) | 21.7% | 26.9% |
| Interquartile Range (IQR) | 14.9% | 13.4% |
| Standard Deviation (Sample) | 26.7% | 10.4% |
| Standard Deviation (Population) | 26.4% | 10.3% |
Similar Demographics by Family Poverty
Demographics Similar to Canadians by Family Poverty
In terms of family poverty, the demographic groups most similar to Canadians are Immigrants from Zimbabwe (8.2%, a difference of 0.090%), Immigrants from France (8.2%, a difference of 0.17%), Taiwanese (8.2%, a difference of 0.28%), Romanian (8.2%, a difference of 0.33%), and Jordanian (8.2%, a difference of 0.42%).
| Demographics | Rating | Rank | Family Poverty |
| Egyptians | 95.1 /100 | #106 | Exceptional 8.1% |
| French Canadians | 95.0 /100 | #107 | Exceptional 8.1% |
| Basques | 94.9 /100 | #108 | Exceptional 8.1% |
| Jordanians | 94.8 /100 | #109 | Exceptional 8.2% |
| Romanians | 94.7 /100 | #110 | Exceptional 8.2% |
| Taiwanese | 94.6 /100 | #111 | Exceptional 8.2% |
| Immigrants | France | 94.4 /100 | #112 | Exceptional 8.2% |
| Canadians | 94.2 /100 | #113 | Exceptional 8.2% |
| Immigrants | Zimbabwe | 94.0 /100 | #114 | Exceptional 8.2% |
| Immigrants | Israel | 93.5 /100 | #115 | Exceptional 8.2% |
| South Africans | 93.4 /100 | #116 | Exceptional 8.2% |
| Immigrants | Russia | 93.2 /100 | #117 | Exceptional 8.2% |
| Immigrants | Western Europe | 92.9 /100 | #118 | Exceptional 8.2% |
| French | 92.8 /100 | #119 | Exceptional 8.3% |
| Immigrants | Egypt | 91.6 /100 | #120 | Exceptional 8.3% |
Demographics Similar to Lumbee by Family Poverty
In terms of family poverty, the demographic groups most similar to Lumbee are Pueblo (17.0%, a difference of 0.070%), Yuman (16.6%, a difference of 2.1%), Immigrants from Yemen (17.5%, a difference of 2.8%), Crow (16.1%, a difference of 5.5%), and Hopi (15.9%, a difference of 6.7%).
| Demographics | Rating | Rank | Family Poverty |
| Immigrants | Dominican Republic | 0.0 /100 | #333 | Tragic 14.4% |
| Houma | 0.0 /100 | #334 | Tragic 14.6% |
| Apache | 0.0 /100 | #335 | Tragic 14.7% |
| Sioux | 0.0 /100 | #336 | Tragic 15.9% |
| Hopi | 0.0 /100 | #337 | Tragic 15.9% |
| Crow | 0.0 /100 | #338 | Tragic 16.1% |
| Yuman | 0.0 /100 | #339 | Tragic 16.6% |
| Pueblo | 0.0 /100 | #340 | Tragic 17.0% |
| Lumbee | 0.0 /100 | #341 | Tragic 17.0% |
| Immigrants | Yemen | 0.0 /100 | #342 | Tragic 17.5% |
| Pima | 0.0 /100 | #343 | Tragic 18.4% |
| Yup'ik | 0.0 /100 | #344 | Tragic 18.7% |
| Navajo | 0.0 /100 | #345 | Tragic 18.8% |
| Puerto Ricans | 0.0 /100 | #346 | Tragic 20.3% |
| Tohono O'odham | 0.0 /100 | #347 | Tragic 20.4% |