Immigrants from Chile vs Lumbee Male Disability
COMPARE
Immigrants from Chile
Lumbee
Male Disability
Male Disability Comparison
Immigrants from Chile
Lumbee
10.6%
MALE DISABILITY
98.3/ 100
METRIC RATING
81st/ 347
METRIC RANK
15.2%
MALE DISABILITY
0.0/ 100
METRIC RATING
340th/ 347
METRIC RANK
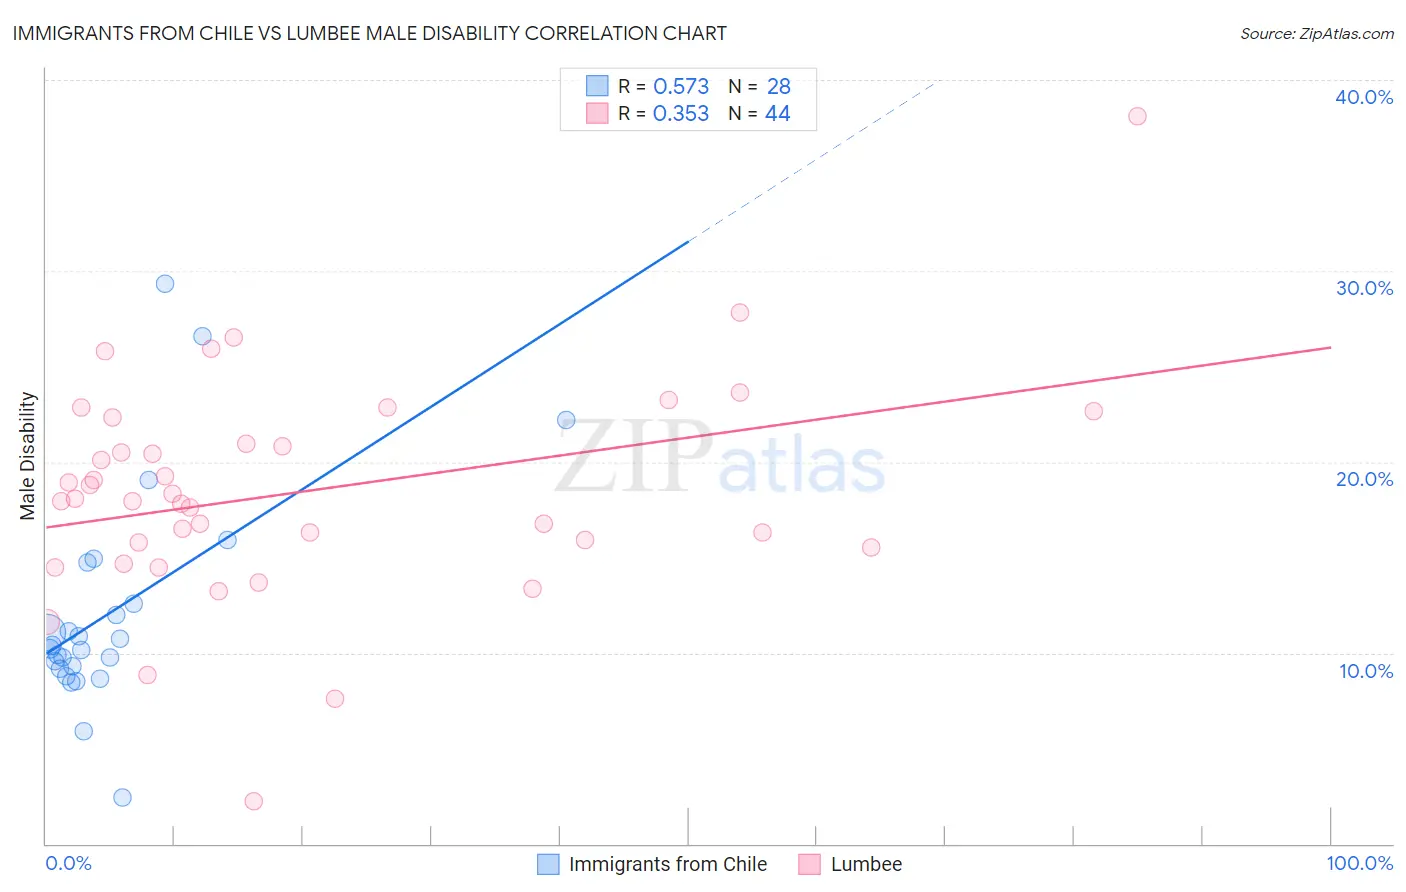
Immigrants from Chile vs Lumbee Male Disability Correlation Chart
The statistical analysis conducted on geographies consisting of 218,637,346 people shows a substantial positive correlation between the proportion of Immigrants from Chile and percentage of males with a disability in the United States with a correlation coefficient (R) of 0.573 and weighted average of 10.6%. Similarly, the statistical analysis conducted on geographies consisting of 92,279,145 people shows a mild positive correlation between the proportion of Lumbee and percentage of males with a disability in the United States with a correlation coefficient (R) of 0.353 and weighted average of 15.2%, a difference of 43.9%.
Male Disability Correlation Summary
| Measurement | Immigrants from Chile | Lumbee |
| Minimum | 2.4% | 2.2% |
| Maximum | 29.3% | 38.1% |
| Range | 26.9% | 35.8% |
| Mean | 12.2% | 18.5% |
| Median | 10.3% | 18.0% |
| Interquartile 25% (IQ1) | 9.2% | 15.7% |
| Interquartile 75% (IQ3) | 13.6% | 21.6% |
| Interquartile Range (IQR) | 4.4% | 6.0% |
| Standard Deviation (Sample) | 5.8% | 5.9% |
| Standard Deviation (Population) | 5.7% | 5.8% |
Similar Demographics by Male Disability
Demographics Similar to Immigrants from Chile by Male Disability
In terms of male disability, the demographic groups most similar to Immigrants from Chile are Immigrants from Jordan (10.6%, a difference of 0.060%), Immigrants from Guyana (10.6%, a difference of 0.070%), Zimbabwean (10.6%, a difference of 0.080%), Immigrants from Poland (10.6%, a difference of 0.13%), and Bulgarian (10.6%, a difference of 0.14%).
| Demographics | Rating | Rank | Male Disability |
| Immigrants | Lebanon | 98.8 /100 | #74 | Exceptional 10.5% |
| Sierra Leoneans | 98.7 /100 | #75 | Exceptional 10.5% |
| Immigrants | Sierra Leone | 98.7 /100 | #76 | Exceptional 10.5% |
| Laotians | 98.6 /100 | #77 | Exceptional 10.6% |
| Immigrants | Russia | 98.6 /100 | #78 | Exceptional 10.6% |
| Zimbabweans | 98.4 /100 | #79 | Exceptional 10.6% |
| Immigrants | Jordan | 98.4 /100 | #80 | Exceptional 10.6% |
| Immigrants | Chile | 98.3 /100 | #81 | Exceptional 10.6% |
| Immigrants | Guyana | 98.2 /100 | #82 | Exceptional 10.6% |
| Immigrants | Poland | 98.1 /100 | #83 | Exceptional 10.6% |
| Bulgarians | 98.1 /100 | #84 | Exceptional 10.6% |
| Sri Lankans | 97.9 /100 | #85 | Exceptional 10.6% |
| Immigrants | Ireland | 97.9 /100 | #86 | Exceptional 10.6% |
| Immigrants | Vietnam | 97.9 /100 | #87 | Exceptional 10.6% |
| Immigrants | Western Asia | 97.8 /100 | #88 | Exceptional 10.6% |
Demographics Similar to Lumbee by Male Disability
In terms of male disability, the demographic groups most similar to Lumbee are Chickasaw (15.1%, a difference of 0.74%), Choctaw (15.4%, a difference of 1.1%), Kiowa (15.4%, a difference of 1.3%), Pueblo (15.0%, a difference of 1.5%), and Menominee (15.0%, a difference of 1.7%).
| Demographics | Rating | Rank | Male Disability |
| Yuman | 0.0 /100 | #333 | Tragic 14.7% |
| Cherokee | 0.0 /100 | #334 | Tragic 14.8% |
| Dutch West Indians | 0.0 /100 | #335 | Tragic 14.8% |
| Alaskan Athabascans | 0.0 /100 | #336 | Tragic 14.9% |
| Menominee | 0.0 /100 | #337 | Tragic 15.0% |
| Pueblo | 0.0 /100 | #338 | Tragic 15.0% |
| Chickasaw | 0.0 /100 | #339 | Tragic 15.1% |
| Lumbee | 0.0 /100 | #340 | Tragic 15.2% |
| Choctaw | 0.0 /100 | #341 | Tragic 15.4% |
| Kiowa | 0.0 /100 | #342 | Tragic 15.4% |
| Creek | 0.0 /100 | #343 | Tragic 15.5% |
| Puerto Ricans | 0.0 /100 | #344 | Tragic 15.6% |
| Tsimshian | 0.0 /100 | #345 | Tragic 15.6% |
| Colville | 0.0 /100 | #346 | Tragic 16.5% |
| Houma | 0.0 /100 | #347 | Tragic 17.4% |