Canadian vs Cypriot Male Disability
COMPARE
Canadian
Cypriot
Male Disability
Male Disability Comparison
Canadians
Cypriots
12.2%
MALE DISABILITY
0.2/ 100
METRIC RATING
263rd/ 347
METRIC RANK
10.0%
MALE DISABILITY
100.0/ 100
METRIC RATING
23rd/ 347
METRIC RANK
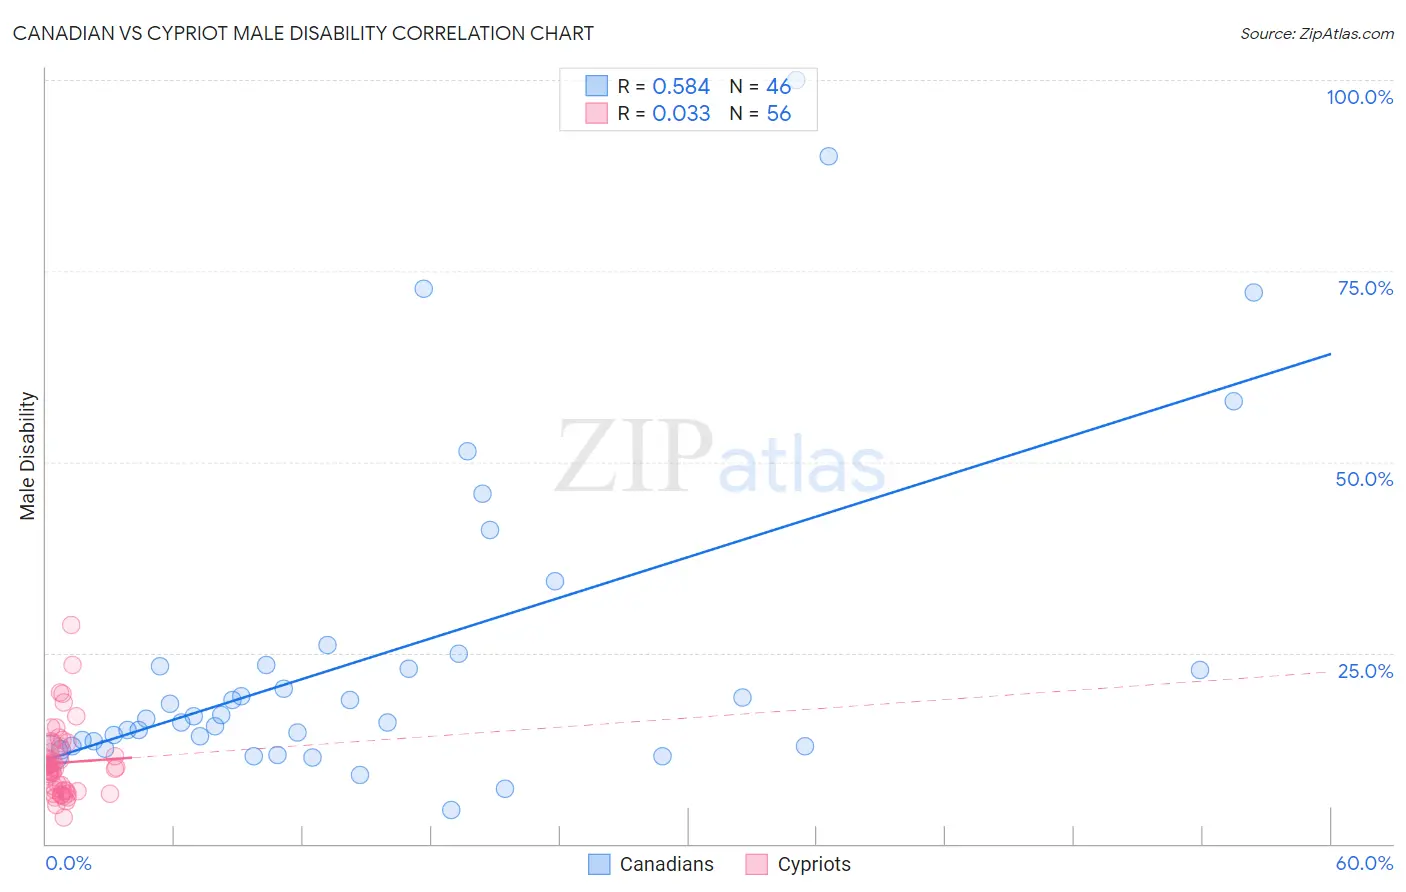
Canadian vs Cypriot Male Disability Correlation Chart
The statistical analysis conducted on geographies consisting of 437,467,484 people shows a substantial positive correlation between the proportion of Canadians and percentage of males with a disability in the United States with a correlation coefficient (R) of 0.584 and weighted average of 12.2%. Similarly, the statistical analysis conducted on geographies consisting of 61,868,977 people shows no correlation between the proportion of Cypriots and percentage of males with a disability in the United States with a correlation coefficient (R) of 0.033 and weighted average of 10.0%, a difference of 21.8%.
Male Disability Correlation Summary
| Measurement | Canadian | Cypriot |
| Minimum | 4.4% | 3.4% |
| Maximum | 100.0% | 28.7% |
| Range | 95.6% | 25.3% |
| Mean | 25.0% | 10.6% |
| Median | 16.5% | 9.9% |
| Interquartile 25% (IQ1) | 12.7% | 6.9% |
| Interquartile 75% (IQ3) | 23.4% | 12.3% |
| Interquartile Range (IQR) | 10.7% | 5.4% |
| Standard Deviation (Sample) | 21.6% | 4.7% |
| Standard Deviation (Population) | 21.3% | 4.6% |
Similar Demographics by Male Disability
Demographics Similar to Canadians by Male Disability
In terms of male disability, the demographic groups most similar to Canadians are Nepalese (12.2%, a difference of 0.030%), Norwegian (12.2%, a difference of 0.20%), Slavic (12.2%, a difference of 0.21%), Immigrants from Portugal (12.3%, a difference of 0.49%), and Hawaiian (12.3%, a difference of 0.51%).
| Demographics | Rating | Rank | Male Disability |
| Swiss | 0.3 /100 | #256 | Tragic 12.1% |
| Europeans | 0.3 /100 | #257 | Tragic 12.1% |
| Basques | 0.3 /100 | #258 | Tragic 12.1% |
| Belgians | 0.3 /100 | #259 | Tragic 12.1% |
| Swedes | 0.3 /100 | #260 | Tragic 12.1% |
| Slavs | 0.2 /100 | #261 | Tragic 12.2% |
| Norwegians | 0.2 /100 | #262 | Tragic 12.2% |
| Canadians | 0.2 /100 | #263 | Tragic 12.2% |
| Nepalese | 0.2 /100 | #264 | Tragic 12.2% |
| Immigrants | Portugal | 0.1 /100 | #265 | Tragic 12.3% |
| Hawaiians | 0.1 /100 | #266 | Tragic 12.3% |
| Immigrants | Germany | 0.1 /100 | #267 | Tragic 12.3% |
| Portuguese | 0.1 /100 | #268 | Tragic 12.3% |
| Czechoslovakians | 0.1 /100 | #269 | Tragic 12.3% |
| Spaniards | 0.1 /100 | #270 | Tragic 12.3% |
Demographics Similar to Cypriots by Male Disability
In terms of male disability, the demographic groups most similar to Cypriots are Immigrants from Venezuela (10.0%, a difference of 0.090%), Immigrants from Asia (10.0%, a difference of 0.14%), Immigrants from Malaysia (10.0%, a difference of 0.32%), Burmese (10.0%, a difference of 0.38%), and Paraguayan (10.1%, a difference of 0.45%).
| Demographics | Rating | Rank | Male Disability |
| Okinawans | 100.0 /100 | #16 | Exceptional 9.8% |
| Immigrants | Korea | 100.0 /100 | #17 | Exceptional 9.8% |
| Immigrants | Pakistan | 100.0 /100 | #18 | Exceptional 9.8% |
| Immigrants | Sri Lanka | 100.0 /100 | #19 | Exceptional 10.0% |
| Asians | 100.0 /100 | #20 | Exceptional 10.0% |
| Burmese | 100.0 /100 | #21 | Exceptional 10.0% |
| Immigrants | Venezuela | 100.0 /100 | #22 | Exceptional 10.0% |
| Cypriots | 100.0 /100 | #23 | Exceptional 10.0% |
| Immigrants | Asia | 100.0 /100 | #24 | Exceptional 10.0% |
| Immigrants | Malaysia | 99.9 /100 | #25 | Exceptional 10.0% |
| Paraguayans | 99.9 /100 | #26 | Exceptional 10.1% |
| Egyptians | 99.9 /100 | #27 | Exceptional 10.1% |
| Vietnamese | 99.9 /100 | #28 | Exceptional 10.1% |
| Venezuelans | 99.9 /100 | #29 | Exceptional 10.1% |
| Immigrants | Egypt | 99.9 /100 | #30 | Exceptional 10.1% |