Immigrants from Asia vs Lumbee Male Disability
COMPARE
Immigrants from Asia
Lumbee
Male Disability
Male Disability Comparison
Immigrants from Asia
Lumbee
10.0%
MALE DISABILITY
100.0/ 100
METRIC RATING
24th/ 347
METRIC RANK
15.2%
MALE DISABILITY
0.0/ 100
METRIC RATING
340th/ 347
METRIC RANK
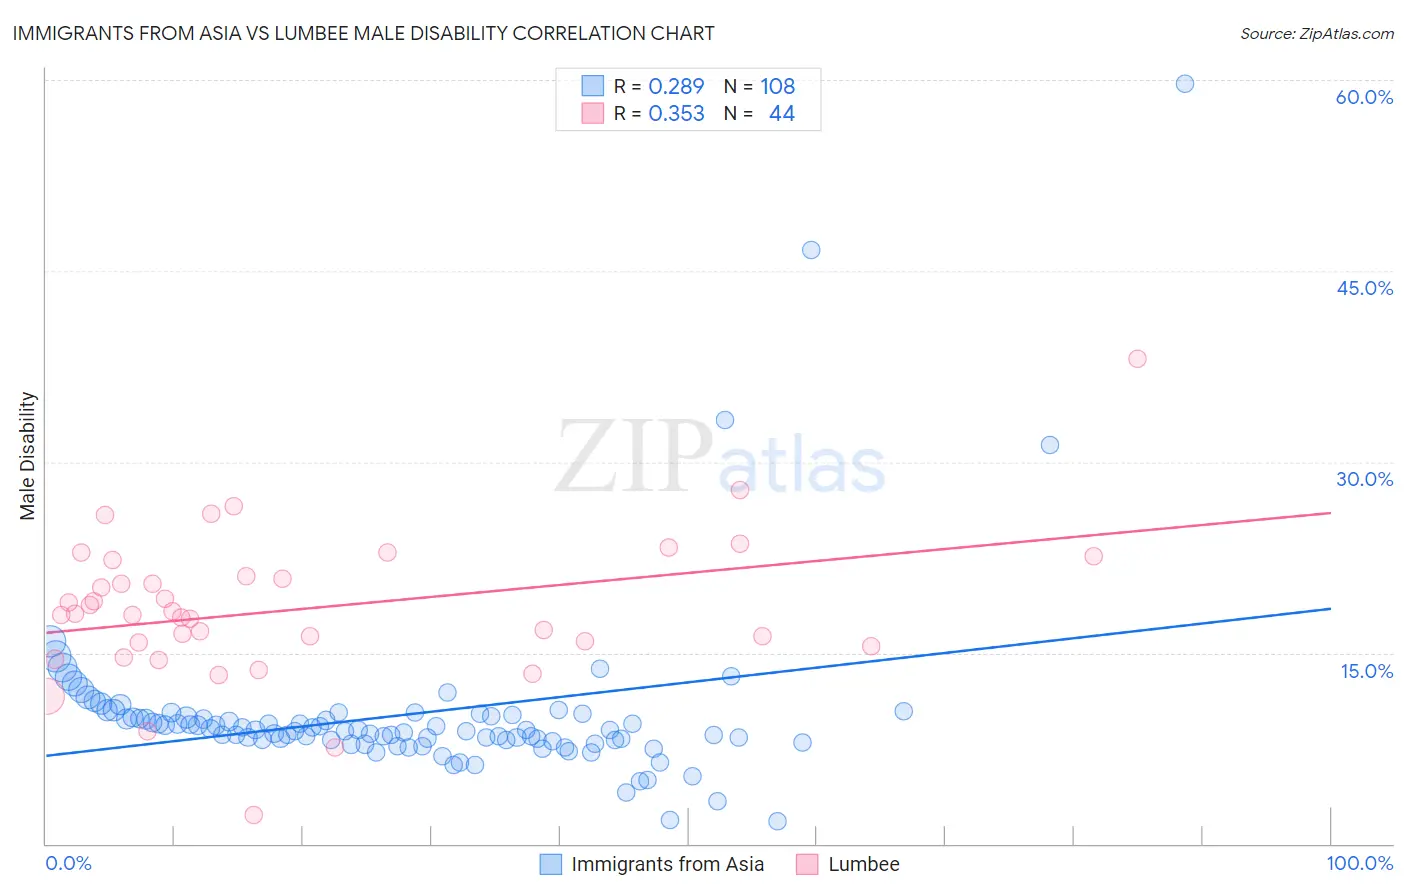
Immigrants from Asia vs Lumbee Male Disability Correlation Chart
The statistical analysis conducted on geographies consisting of 548,953,248 people shows a weak positive correlation between the proportion of Immigrants from Asia and percentage of males with a disability in the United States with a correlation coefficient (R) of 0.289 and weighted average of 10.0%. Similarly, the statistical analysis conducted on geographies consisting of 92,279,145 people shows a mild positive correlation between the proportion of Lumbee and percentage of males with a disability in the United States with a correlation coefficient (R) of 0.353 and weighted average of 15.2%, a difference of 51.9%.
Male Disability Correlation Summary
| Measurement | Immigrants from Asia | Lumbee |
| Minimum | 1.8% | 2.2% |
| Maximum | 59.7% | 38.1% |
| Range | 57.9% | 35.8% |
| Mean | 10.2% | 18.5% |
| Median | 8.9% | 18.0% |
| Interquartile 25% (IQ1) | 8.1% | 15.7% |
| Interquartile 75% (IQ3) | 10.1% | 21.6% |
| Interquartile Range (IQR) | 1.9% | 6.0% |
| Standard Deviation (Sample) | 7.1% | 5.9% |
| Standard Deviation (Population) | 7.1% | 5.8% |
Similar Demographics by Male Disability
Demographics Similar to Immigrants from Asia by Male Disability
In terms of male disability, the demographic groups most similar to Immigrants from Asia are Cypriot (10.0%, a difference of 0.14%), Immigrants from Malaysia (10.0%, a difference of 0.19%), Immigrants from Venezuela (10.0%, a difference of 0.23%), Paraguayan (10.1%, a difference of 0.32%), and Burmese (10.0%, a difference of 0.51%).
| Demographics | Rating | Rank | Male Disability |
| Immigrants | Korea | 100.0 /100 | #17 | Exceptional 9.8% |
| Immigrants | Pakistan | 100.0 /100 | #18 | Exceptional 9.8% |
| Immigrants | Sri Lanka | 100.0 /100 | #19 | Exceptional 10.0% |
| Asians | 100.0 /100 | #20 | Exceptional 10.0% |
| Burmese | 100.0 /100 | #21 | Exceptional 10.0% |
| Immigrants | Venezuela | 100.0 /100 | #22 | Exceptional 10.0% |
| Cypriots | 100.0 /100 | #23 | Exceptional 10.0% |
| Immigrants | Asia | 100.0 /100 | #24 | Exceptional 10.0% |
| Immigrants | Malaysia | 99.9 /100 | #25 | Exceptional 10.0% |
| Paraguayans | 99.9 /100 | #26 | Exceptional 10.1% |
| Egyptians | 99.9 /100 | #27 | Exceptional 10.1% |
| Vietnamese | 99.9 /100 | #28 | Exceptional 10.1% |
| Venezuelans | 99.9 /100 | #29 | Exceptional 10.1% |
| Immigrants | Egypt | 99.9 /100 | #30 | Exceptional 10.1% |
| Soviet Union | 99.9 /100 | #31 | Exceptional 10.1% |
Demographics Similar to Lumbee by Male Disability
In terms of male disability, the demographic groups most similar to Lumbee are Chickasaw (15.1%, a difference of 0.74%), Choctaw (15.4%, a difference of 1.1%), Kiowa (15.4%, a difference of 1.3%), Pueblo (15.0%, a difference of 1.5%), and Menominee (15.0%, a difference of 1.7%).
| Demographics | Rating | Rank | Male Disability |
| Yuman | 0.0 /100 | #333 | Tragic 14.7% |
| Cherokee | 0.0 /100 | #334 | Tragic 14.8% |
| Dutch West Indians | 0.0 /100 | #335 | Tragic 14.8% |
| Alaskan Athabascans | 0.0 /100 | #336 | Tragic 14.9% |
| Menominee | 0.0 /100 | #337 | Tragic 15.0% |
| Pueblo | 0.0 /100 | #338 | Tragic 15.0% |
| Chickasaw | 0.0 /100 | #339 | Tragic 15.1% |
| Lumbee | 0.0 /100 | #340 | Tragic 15.2% |
| Choctaw | 0.0 /100 | #341 | Tragic 15.4% |
| Kiowa | 0.0 /100 | #342 | Tragic 15.4% |
| Creek | 0.0 /100 | #343 | Tragic 15.5% |
| Puerto Ricans | 0.0 /100 | #344 | Tragic 15.6% |
| Tsimshian | 0.0 /100 | #345 | Tragic 15.6% |
| Colville | 0.0 /100 | #346 | Tragic 16.5% |
| Houma | 0.0 /100 | #347 | Tragic 17.4% |