Canadian vs Central American Male Disability
COMPARE
Canadian
Central American
Male Disability
Male Disability Comparison
Canadians
Central Americans
12.2%
MALE DISABILITY
0.2/ 100
METRIC RATING
263rd/ 347
METRIC RANK
10.8%
MALE DISABILITY
92.7/ 100
METRIC RATING
114th/ 347
METRIC RANK
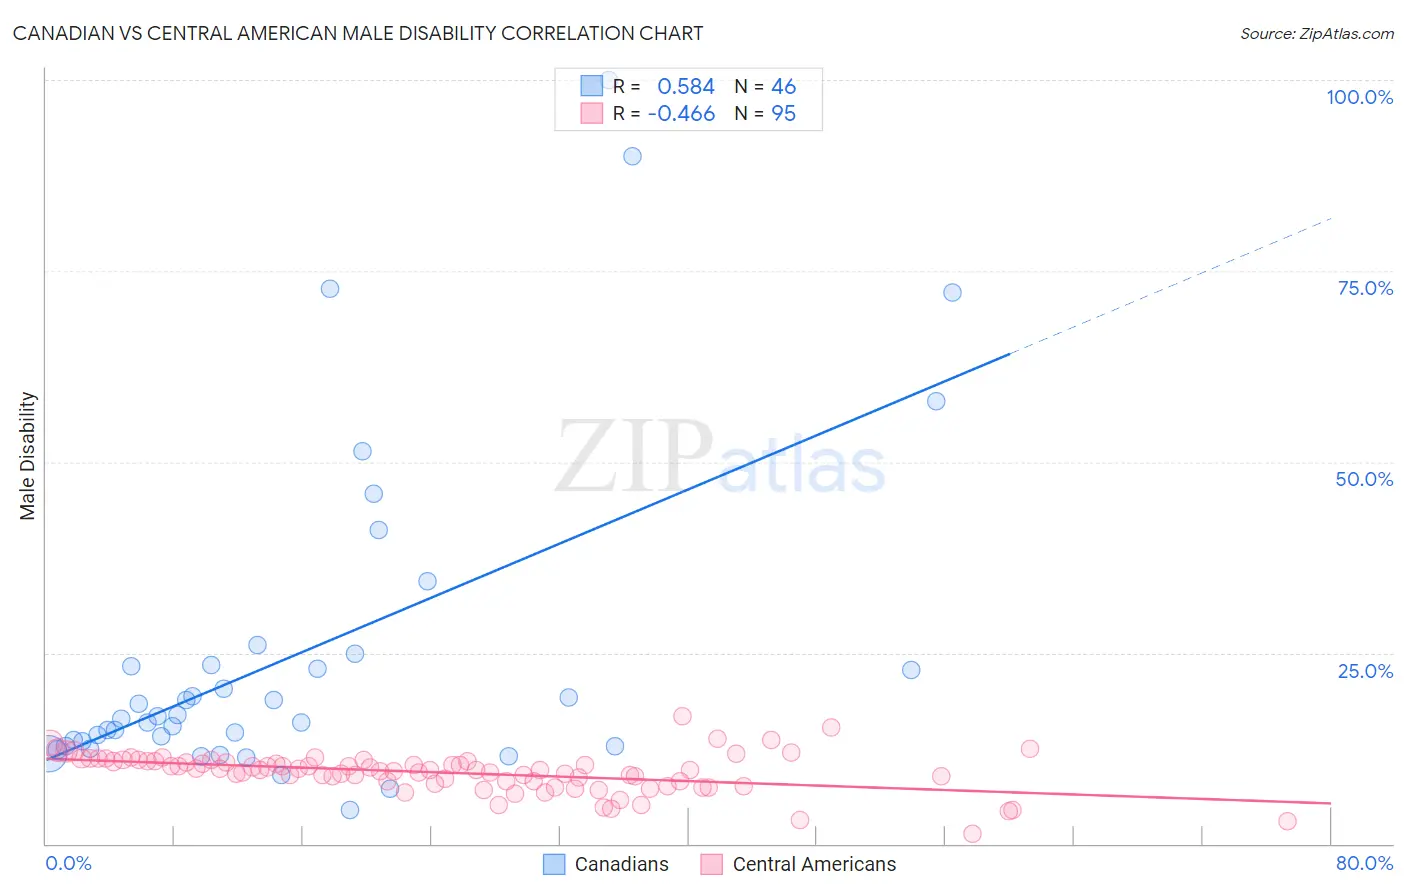
Canadian vs Central American Male Disability Correlation Chart
The statistical analysis conducted on geographies consisting of 437,467,484 people shows a substantial positive correlation between the proportion of Canadians and percentage of males with a disability in the United States with a correlation coefficient (R) of 0.584 and weighted average of 12.2%. Similarly, the statistical analysis conducted on geographies consisting of 504,432,725 people shows a moderate negative correlation between the proportion of Central Americans and percentage of males with a disability in the United States with a correlation coefficient (R) of -0.466 and weighted average of 10.8%, a difference of 12.7%.
Male Disability Correlation Summary
| Measurement | Canadian | Central American |
| Minimum | 4.4% | 1.3% |
| Maximum | 100.0% | 16.7% |
| Range | 95.6% | 15.5% |
| Mean | 25.0% | 9.3% |
| Median | 16.5% | 9.7% |
| Interquartile 25% (IQ1) | 12.7% | 8.1% |
| Interquartile 75% (IQ3) | 23.4% | 10.8% |
| Interquartile Range (IQR) | 10.7% | 2.7% |
| Standard Deviation (Sample) | 21.6% | 2.5% |
| Standard Deviation (Population) | 21.3% | 2.5% |
Similar Demographics by Male Disability
Demographics Similar to Canadians by Male Disability
In terms of male disability, the demographic groups most similar to Canadians are Nepalese (12.2%, a difference of 0.030%), Norwegian (12.2%, a difference of 0.20%), Slavic (12.2%, a difference of 0.21%), Immigrants from Portugal (12.3%, a difference of 0.49%), and Hawaiian (12.3%, a difference of 0.51%).
| Demographics | Rating | Rank | Male Disability |
| Swiss | 0.3 /100 | #256 | Tragic 12.1% |
| Europeans | 0.3 /100 | #257 | Tragic 12.1% |
| Basques | 0.3 /100 | #258 | Tragic 12.1% |
| Belgians | 0.3 /100 | #259 | Tragic 12.1% |
| Swedes | 0.3 /100 | #260 | Tragic 12.1% |
| Slavs | 0.2 /100 | #261 | Tragic 12.2% |
| Norwegians | 0.2 /100 | #262 | Tragic 12.2% |
| Canadians | 0.2 /100 | #263 | Tragic 12.2% |
| Nepalese | 0.2 /100 | #264 | Tragic 12.2% |
| Immigrants | Portugal | 0.1 /100 | #265 | Tragic 12.3% |
| Hawaiians | 0.1 /100 | #266 | Tragic 12.3% |
| Immigrants | Germany | 0.1 /100 | #267 | Tragic 12.3% |
| Portuguese | 0.1 /100 | #268 | Tragic 12.3% |
| Czechoslovakians | 0.1 /100 | #269 | Tragic 12.3% |
| Spaniards | 0.1 /100 | #270 | Tragic 12.3% |
Demographics Similar to Central Americans by Male Disability
In terms of male disability, the demographic groups most similar to Central Americans are Immigrants from Zimbabwe (10.8%, a difference of 0.070%), Immigrants from Barbados (10.8%, a difference of 0.10%), Ghanaian (10.8%, a difference of 0.15%), Immigrants from South Africa (10.8%, a difference of 0.17%), and Immigrants from Uruguay (10.8%, a difference of 0.25%).
| Demographics | Rating | Rank | Male Disability |
| Immigrants | Eastern Africa | 94.3 /100 | #107 | Exceptional 10.8% |
| Immigrants | Belgium | 94.2 /100 | #108 | Exceptional 10.8% |
| Immigrants | Uganda | 94.0 /100 | #109 | Exceptional 10.8% |
| Immigrants | Immigrants | 93.9 /100 | #110 | Exceptional 10.8% |
| Immigrants | Uruguay | 93.8 /100 | #111 | Exceptional 10.8% |
| Ghanaians | 93.4 /100 | #112 | Exceptional 10.8% |
| Immigrants | Zimbabwe | 93.0 /100 | #113 | Exceptional 10.8% |
| Central Americans | 92.7 /100 | #114 | Exceptional 10.8% |
| Immigrants | Barbados | 92.2 /100 | #115 | Exceptional 10.8% |
| Immigrants | South Africa | 91.8 /100 | #116 | Exceptional 10.8% |
| Eastern Europeans | 90.6 /100 | #117 | Exceptional 10.9% |
| Immigrants | Cuba | 90.2 /100 | #118 | Exceptional 10.9% |
| Armenians | 90.1 /100 | #119 | Exceptional 10.9% |
| Immigrants | Africa | 89.4 /100 | #120 | Excellent 10.9% |
| Immigrants | South Eastern Asia | 89.2 /100 | #121 | Excellent 10.9% |