Brazilian vs African Disability Age 5 to 17
COMPARE
Brazilian
African
Disability Age 5 to 17
Disability Age 5 to 17 Comparison
Brazilians
Africans
5.9%
DISABILITY AGE 5 TO 17
0.9/ 100
METRIC RATING
258th/ 347
METRIC RANK
6.5%
DISABILITY AGE 5 TO 17
0.0/ 100
METRIC RATING
320th/ 347
METRIC RANK
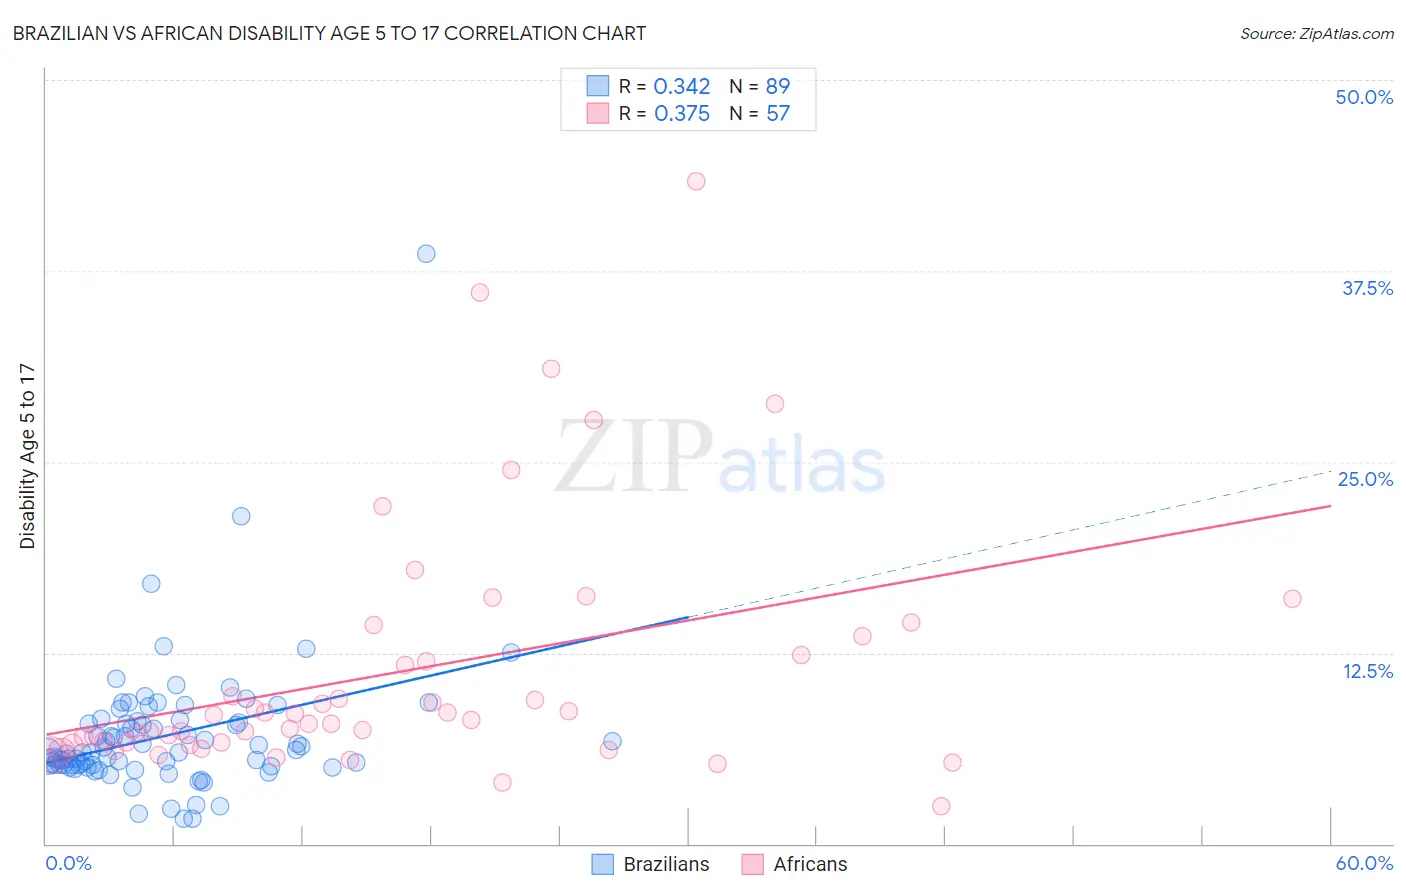
Brazilian vs African Disability Age 5 to 17 Correlation Chart
The statistical analysis conducted on geographies consisting of 321,958,150 people shows a mild positive correlation between the proportion of Brazilians and percentage of population with a disability between the ages 5 and 17 in the United States with a correlation coefficient (R) of 0.342 and weighted average of 5.9%. Similarly, the statistical analysis conducted on geographies consisting of 465,699,763 people shows a mild positive correlation between the proportion of Africans and percentage of population with a disability between the ages 5 and 17 in the United States with a correlation coefficient (R) of 0.375 and weighted average of 6.5%, a difference of 9.6%.
Disability Age 5 to 17 Correlation Summary
| Measurement | Brazilian | African |
| Minimum | 1.6% | 2.5% |
| Maximum | 38.7% | 43.3% |
| Range | 37.1% | 40.9% |
| Mean | 7.1% | 11.3% |
| Median | 6.0% | 8.1% |
| Interquartile 25% (IQ1) | 5.1% | 6.5% |
| Interquartile 75% (IQ3) | 8.0% | 13.0% |
| Interquartile Range (IQR) | 2.8% | 6.5% |
| Standard Deviation (Sample) | 4.5% | 8.3% |
| Standard Deviation (Population) | 4.5% | 8.2% |
Similar Demographics by Disability Age 5 to 17
Demographics Similar to Brazilians by Disability Age 5 to 17
In terms of disability age 5 to 17, the demographic groups most similar to Brazilians are Hispanic or Latino (5.9%, a difference of 0.040%), Slavic (5.9%, a difference of 0.060%), Hopi (5.9%, a difference of 0.13%), Somali (5.9%, a difference of 0.19%), and Immigrants from Middle Africa (5.9%, a difference of 0.26%).
| Demographics | Rating | Rank | Disability Age 5 to 17 |
| Immigrants | Cambodia | 1.5 /100 | #251 | Tragic 5.9% |
| Hondurans | 1.5 /100 | #252 | Tragic 5.9% |
| Scandinavians | 1.4 /100 | #253 | Tragic 5.9% |
| Barbadians | 1.3 /100 | #254 | Tragic 5.9% |
| Italians | 1.2 /100 | #255 | Tragic 5.9% |
| Hopi | 1.0 /100 | #256 | Tragic 5.9% |
| Hispanics or Latinos | 1.0 /100 | #257 | Tragic 5.9% |
| Brazilians | 0.9 /100 | #258 | Tragic 5.9% |
| Slavs | 0.9 /100 | #259 | Tragic 5.9% |
| Somalis | 0.8 /100 | #260 | Tragic 5.9% |
| Immigrants | Middle Africa | 0.7 /100 | #261 | Tragic 5.9% |
| Immigrants | Western Africa | 0.7 /100 | #262 | Tragic 5.9% |
| Czechoslovakians | 0.7 /100 | #263 | Tragic 5.9% |
| Canadians | 0.6 /100 | #264 | Tragic 6.0% |
| Panamanians | 0.6 /100 | #265 | Tragic 6.0% |
Demographics Similar to Africans by Disability Age 5 to 17
In terms of disability age 5 to 17, the demographic groups most similar to Africans are Delaware (6.5%, a difference of 0.19%), Tohono O'odham (6.5%, a difference of 0.35%), Slovak (6.5%, a difference of 0.36%), Osage (6.5%, a difference of 0.40%), and Dominican (6.5%, a difference of 0.48%).
| Demographics | Rating | Rank | Disability Age 5 to 17 |
| Apache | 0.0 /100 | #313 | Tragic 6.4% |
| French | 0.0 /100 | #314 | Tragic 6.4% |
| Immigrants | Portugal | 0.0 /100 | #315 | Tragic 6.4% |
| Immigrants | Dominican Republic | 0.0 /100 | #316 | Tragic 6.4% |
| Kiowa | 0.0 /100 | #317 | Tragic 6.4% |
| Comanche | 0.0 /100 | #318 | Tragic 6.4% |
| Delaware | 0.0 /100 | #319 | Tragic 6.5% |
| Africans | 0.0 /100 | #320 | Tragic 6.5% |
| Tohono O'odham | 0.0 /100 | #321 | Tragic 6.5% |
| Slovaks | 0.0 /100 | #322 | Tragic 6.5% |
| Osage | 0.0 /100 | #323 | Tragic 6.5% |
| Dominicans | 0.0 /100 | #324 | Tragic 6.5% |
| Americans | 0.0 /100 | #325 | Tragic 6.5% |
| Potawatomi | 0.0 /100 | #326 | Tragic 6.5% |
| French American Indians | 0.0 /100 | #327 | Tragic 6.6% |