Brazilian vs Trinidadian and Tobagonian Disability Age 5 to 17
COMPARE
Brazilian
Trinidadian and Tobagonian
Disability Age 5 to 17
Disability Age 5 to 17 Comparison
Brazilians
Trinidadians and Tobagonians
5.9%
DISABILITY AGE 5 TO 17
0.9/ 100
METRIC RATING
258th/ 347
METRIC RANK
5.7%
DISABILITY AGE 5 TO 17
10.8/ 100
METRIC RATING
205th/ 347
METRIC RANK
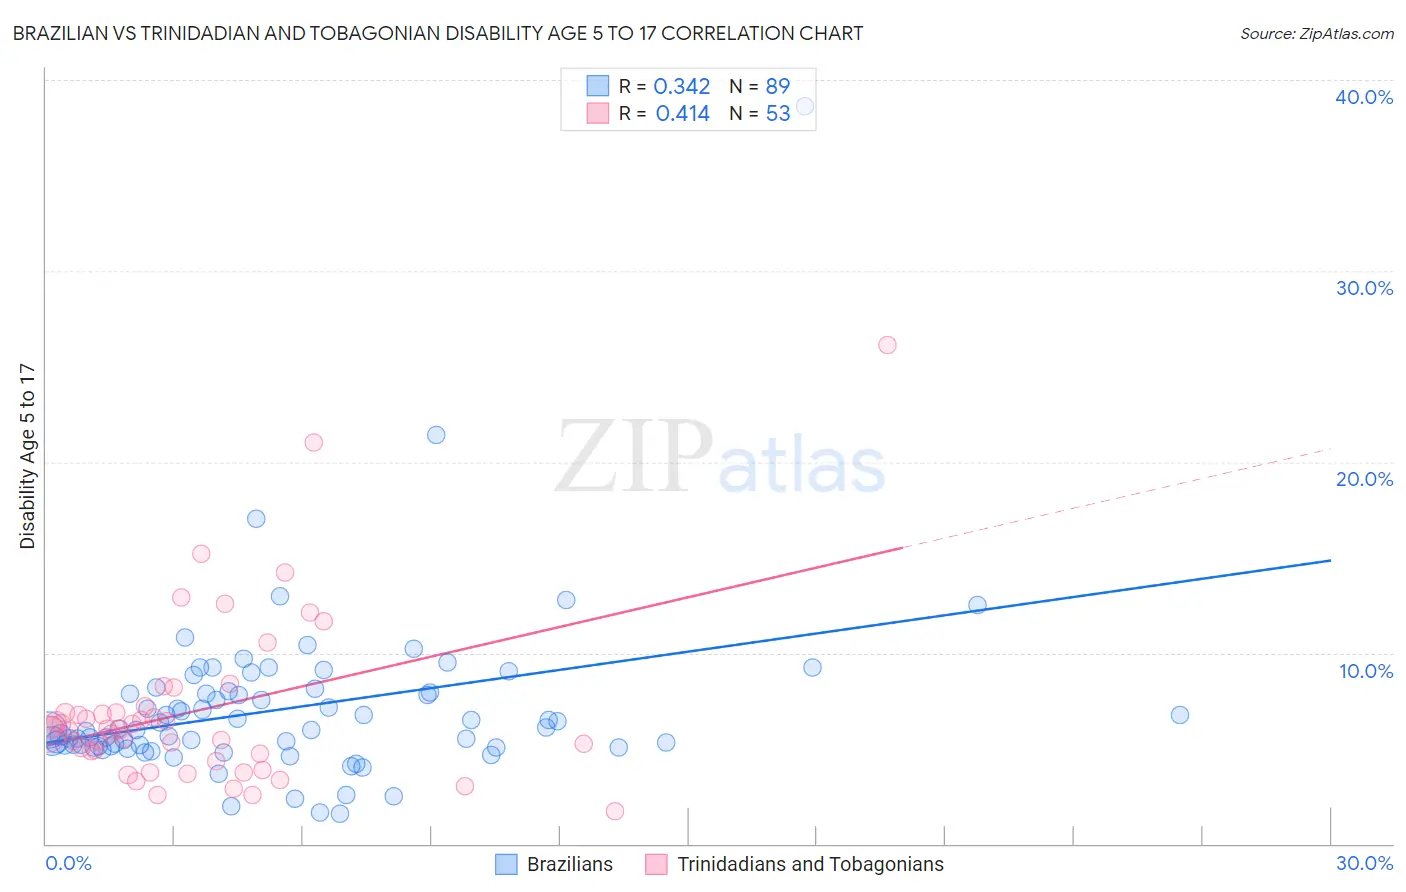
Brazilian vs Trinidadian and Tobagonian Disability Age 5 to 17 Correlation Chart
The statistical analysis conducted on geographies consisting of 321,958,150 people shows a mild positive correlation between the proportion of Brazilians and percentage of population with a disability between the ages 5 and 17 in the United States with a correlation coefficient (R) of 0.342 and weighted average of 5.9%. Similarly, the statistical analysis conducted on geographies consisting of 219,004,260 people shows a moderate positive correlation between the proportion of Trinidadians and Tobagonians and percentage of population with a disability between the ages 5 and 17 in the United States with a correlation coefficient (R) of 0.414 and weighted average of 5.7%, a difference of 3.1%.
Disability Age 5 to 17 Correlation Summary
| Measurement | Brazilian | Trinidadian and Tobagonian |
| Minimum | 1.6% | 1.7% |
| Maximum | 38.7% | 26.1% |
| Range | 37.1% | 24.4% |
| Mean | 7.1% | 7.0% |
| Median | 6.0% | 6.0% |
| Interquartile 25% (IQ1) | 5.1% | 4.5% |
| Interquartile 75% (IQ3) | 8.0% | 7.0% |
| Interquartile Range (IQR) | 2.8% | 2.5% |
| Standard Deviation (Sample) | 4.5% | 4.5% |
| Standard Deviation (Population) | 4.5% | 4.4% |
Similar Demographics by Disability Age 5 to 17
Demographics Similar to Brazilians by Disability Age 5 to 17
In terms of disability age 5 to 17, the demographic groups most similar to Brazilians are Hispanic or Latino (5.9%, a difference of 0.040%), Slavic (5.9%, a difference of 0.060%), Hopi (5.9%, a difference of 0.13%), Somali (5.9%, a difference of 0.19%), and Immigrants from Middle Africa (5.9%, a difference of 0.26%).
| Demographics | Rating | Rank | Disability Age 5 to 17 |
| Immigrants | Cambodia | 1.5 /100 | #251 | Tragic 5.9% |
| Hondurans | 1.5 /100 | #252 | Tragic 5.9% |
| Scandinavians | 1.4 /100 | #253 | Tragic 5.9% |
| Barbadians | 1.3 /100 | #254 | Tragic 5.9% |
| Italians | 1.2 /100 | #255 | Tragic 5.9% |
| Hopi | 1.0 /100 | #256 | Tragic 5.9% |
| Hispanics or Latinos | 1.0 /100 | #257 | Tragic 5.9% |
| Brazilians | 0.9 /100 | #258 | Tragic 5.9% |
| Slavs | 0.9 /100 | #259 | Tragic 5.9% |
| Somalis | 0.8 /100 | #260 | Tragic 5.9% |
| Immigrants | Middle Africa | 0.7 /100 | #261 | Tragic 5.9% |
| Immigrants | Western Africa | 0.7 /100 | #262 | Tragic 5.9% |
| Czechoslovakians | 0.7 /100 | #263 | Tragic 5.9% |
| Canadians | 0.6 /100 | #264 | Tragic 6.0% |
| Panamanians | 0.6 /100 | #265 | Tragic 6.0% |
Demographics Similar to Trinidadians and Tobagonians by Disability Age 5 to 17
In terms of disability age 5 to 17, the demographic groups most similar to Trinidadians and Tobagonians are Immigrants from Africa (5.7%, a difference of 0.0%), Paiute (5.7%, a difference of 0.050%), Moroccan (5.7%, a difference of 0.050%), Kenyan (5.8%, a difference of 0.10%), and Immigrants from Uganda (5.8%, a difference of 0.14%).
| Demographics | Rating | Rank | Disability Age 5 to 17 |
| Norwegians | 20.9 /100 | #198 | Fair 5.7% |
| Northern Europeans | 15.2 /100 | #199 | Poor 5.7% |
| Icelanders | 14.6 /100 | #200 | Poor 5.7% |
| Basques | 13.7 /100 | #201 | Poor 5.7% |
| Austrians | 13.2 /100 | #202 | Poor 5.7% |
| Spanish American Indians | 12.8 /100 | #203 | Poor 5.7% |
| Paiute | 11.2 /100 | #204 | Poor 5.7% |
| Trinidadians and Tobagonians | 10.8 /100 | #205 | Poor 5.7% |
| Immigrants | Africa | 10.8 /100 | #206 | Poor 5.7% |
| Moroccans | 10.4 /100 | #207 | Poor 5.7% |
| Kenyans | 10.0 /100 | #208 | Poor 5.8% |
| Immigrants | Uganda | 9.7 /100 | #209 | Tragic 5.8% |
| Immigrants | Haiti | 9.5 /100 | #210 | Tragic 5.8% |
| Yugoslavians | 9.1 /100 | #211 | Tragic 5.8% |
| Immigrants | Panama | 8.7 /100 | #212 | Tragic 5.8% |