Immigrants from Albania vs African Disability Age 5 to 17
COMPARE
Immigrants from Albania
African
Disability Age 5 to 17
Disability Age 5 to 17 Comparison
Immigrants from Albania
Africans
5.5%
DISABILITY AGE 5 TO 17
83.1/ 100
METRIC RATING
147th/ 347
METRIC RANK
6.5%
DISABILITY AGE 5 TO 17
0.0/ 100
METRIC RATING
320th/ 347
METRIC RANK
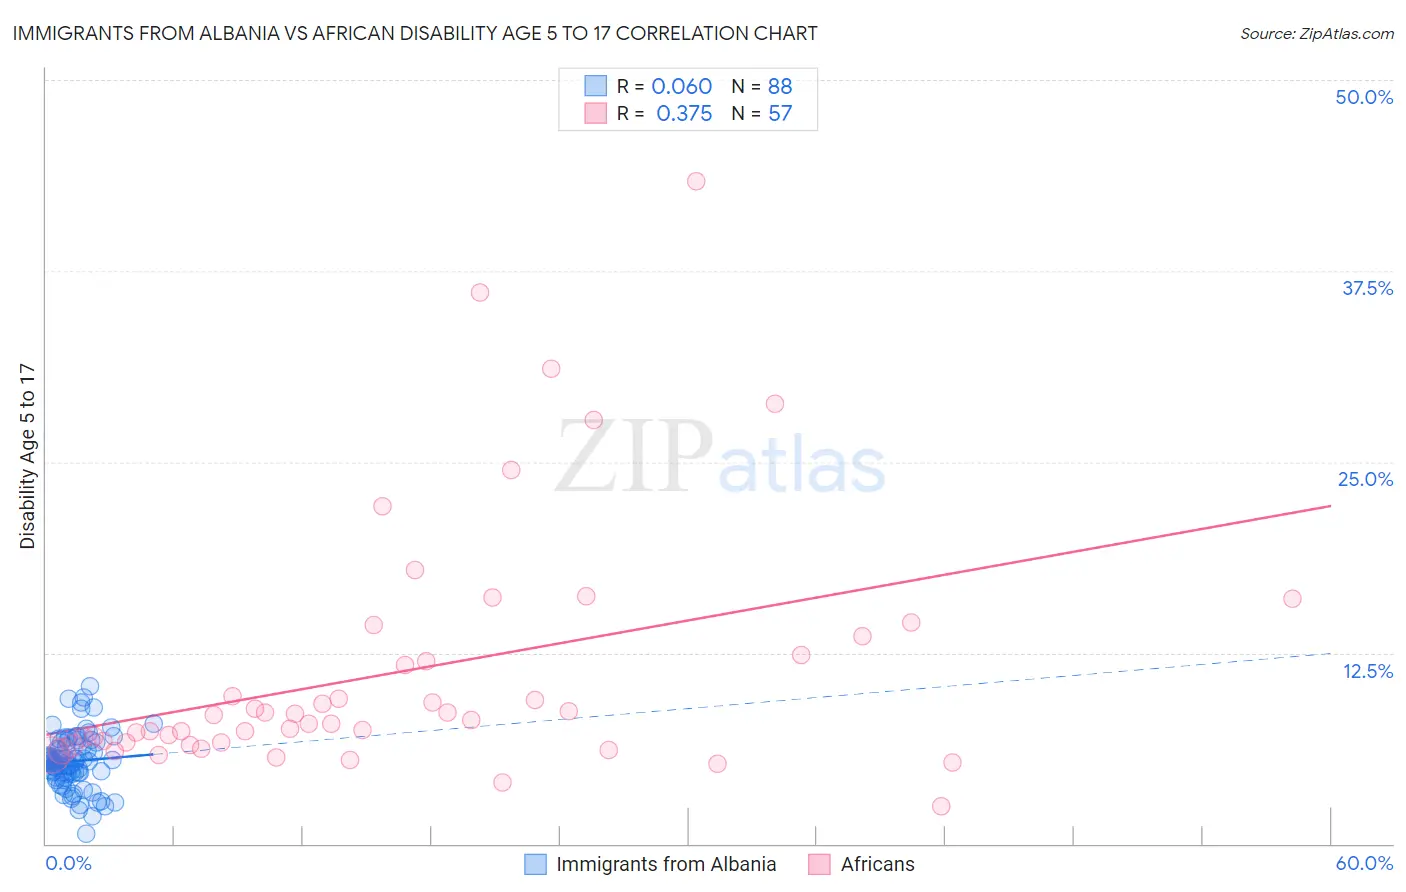
Immigrants from Albania vs African Disability Age 5 to 17 Correlation Chart
The statistical analysis conducted on geographies consisting of 119,036,367 people shows a slight positive correlation between the proportion of Immigrants from Albania and percentage of population with a disability between the ages 5 and 17 in the United States with a correlation coefficient (R) of 0.060 and weighted average of 5.5%. Similarly, the statistical analysis conducted on geographies consisting of 465,699,763 people shows a mild positive correlation between the proportion of Africans and percentage of population with a disability between the ages 5 and 17 in the United States with a correlation coefficient (R) of 0.375 and weighted average of 6.5%, a difference of 18.3%.
Disability Age 5 to 17 Correlation Summary
| Measurement | Immigrants from Albania | African |
| Minimum | 0.68% | 2.5% |
| Maximum | 10.3% | 43.3% |
| Range | 9.6% | 40.9% |
| Mean | 5.4% | 11.3% |
| Median | 5.4% | 8.1% |
| Interquartile 25% (IQ1) | 4.6% | 6.5% |
| Interquartile 75% (IQ3) | 6.5% | 13.0% |
| Interquartile Range (IQR) | 1.9% | 6.5% |
| Standard Deviation (Sample) | 1.8% | 8.3% |
| Standard Deviation (Population) | 1.8% | 8.2% |
Similar Demographics by Disability Age 5 to 17
Demographics Similar to Immigrants from Albania by Disability Age 5 to 17
In terms of disability age 5 to 17, the demographic groups most similar to Immigrants from Albania are Albanian (5.5%, a difference of 0.060%), Samoan (5.5%, a difference of 0.10%), Central American (5.5%, a difference of 0.13%), Guatemalan (5.5%, a difference of 0.13%), and Estonian (5.5%, a difference of 0.20%).
| Demographics | Rating | Rank | Disability Age 5 to 17 |
| Immigrants | Netherlands | 90.5 /100 | #140 | Exceptional 5.4% |
| South American Indians | 89.3 /100 | #141 | Excellent 5.5% |
| Colombians | 88.0 /100 | #142 | Excellent 5.5% |
| Immigrants | Hungary | 87.9 /100 | #143 | Excellent 5.5% |
| Pakistanis | 87.3 /100 | #144 | Excellent 5.5% |
| Immigrants | Guatemala | 86.6 /100 | #145 | Excellent 5.5% |
| Albanians | 83.7 /100 | #146 | Excellent 5.5% |
| Immigrants | Albania | 83.1 /100 | #147 | Excellent 5.5% |
| Samoans | 81.9 /100 | #148 | Excellent 5.5% |
| Central Americans | 81.6 /100 | #149 | Excellent 5.5% |
| Guatemalans | 81.5 /100 | #150 | Excellent 5.5% |
| Estonians | 80.8 /100 | #151 | Excellent 5.5% |
| Ute | 80.6 /100 | #152 | Excellent 5.5% |
| Ecuadorians | 79.7 /100 | #153 | Good 5.5% |
| Australians | 78.8 /100 | #154 | Good 5.5% |
Demographics Similar to Africans by Disability Age 5 to 17
In terms of disability age 5 to 17, the demographic groups most similar to Africans are Delaware (6.5%, a difference of 0.19%), Tohono O'odham (6.5%, a difference of 0.35%), Slovak (6.5%, a difference of 0.36%), Osage (6.5%, a difference of 0.40%), and Dominican (6.5%, a difference of 0.48%).
| Demographics | Rating | Rank | Disability Age 5 to 17 |
| Apache | 0.0 /100 | #313 | Tragic 6.4% |
| French | 0.0 /100 | #314 | Tragic 6.4% |
| Immigrants | Portugal | 0.0 /100 | #315 | Tragic 6.4% |
| Immigrants | Dominican Republic | 0.0 /100 | #316 | Tragic 6.4% |
| Kiowa | 0.0 /100 | #317 | Tragic 6.4% |
| Comanche | 0.0 /100 | #318 | Tragic 6.4% |
| Delaware | 0.0 /100 | #319 | Tragic 6.5% |
| Africans | 0.0 /100 | #320 | Tragic 6.5% |
| Tohono O'odham | 0.0 /100 | #321 | Tragic 6.5% |
| Slovaks | 0.0 /100 | #322 | Tragic 6.5% |
| Osage | 0.0 /100 | #323 | Tragic 6.5% |
| Dominicans | 0.0 /100 | #324 | Tragic 6.5% |
| Americans | 0.0 /100 | #325 | Tragic 6.5% |
| Potawatomi | 0.0 /100 | #326 | Tragic 6.5% |
| French American Indians | 0.0 /100 | #327 | Tragic 6.6% |