Bermudan vs Scottish Disability Age 5 to 17
COMPARE
Bermudan
Scottish
Disability Age 5 to 17
Disability Age 5 to 17 Comparison
Bermudans
Scottish
6.4%
DISABILITY AGE 5 TO 17
0.0/ 100
METRIC RATING
312th/ 347
METRIC RANK
6.1%
DISABILITY AGE 5 TO 17
0.0/ 100
METRIC RATING
281st/ 347
METRIC RANK
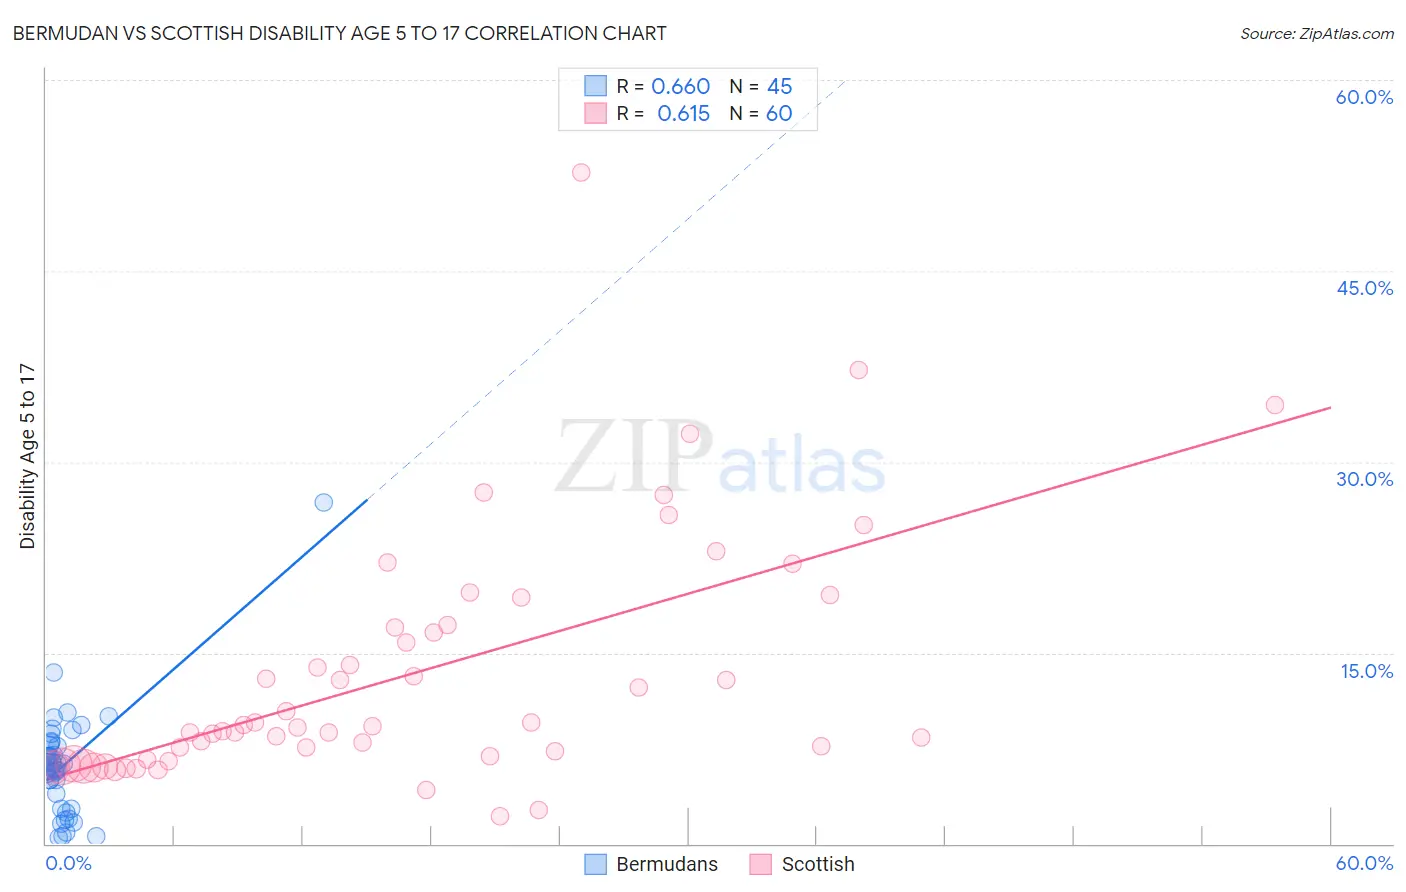
Bermudan vs Scottish Disability Age 5 to 17 Correlation Chart
The statistical analysis conducted on geographies consisting of 55,645,998 people shows a significant positive correlation between the proportion of Bermudans and percentage of population with a disability between the ages 5 and 17 in the United States with a correlation coefficient (R) of 0.660 and weighted average of 6.4%. Similarly, the statistical analysis conducted on geographies consisting of 553,365,795 people shows a significant positive correlation between the proportion of Scottish and percentage of population with a disability between the ages 5 and 17 in the United States with a correlation coefficient (R) of 0.615 and weighted average of 6.1%, a difference of 3.6%.
Disability Age 5 to 17 Correlation Summary
| Measurement | Bermudan | Scottish |
| Minimum | 0.50% | 2.1% |
| Maximum | 26.8% | 52.7% |
| Range | 26.3% | 50.6% |
| Mean | 6.2% | 13.3% |
| Median | 6.2% | 9.1% |
| Interquartile 25% (IQ1) | 3.3% | 6.8% |
| Interquartile 75% (IQ3) | 7.9% | 17.1% |
| Interquartile Range (IQR) | 4.5% | 10.3% |
| Standard Deviation (Sample) | 4.3% | 9.6% |
| Standard Deviation (Population) | 4.3% | 9.5% |
Similar Demographics by Disability Age 5 to 17
Demographics Similar to Bermudans by Disability Age 5 to 17
In terms of disability age 5 to 17, the demographic groups most similar to Bermudans are Immigrants from Dominica (6.3%, a difference of 0.12%), Alaskan Athabascan (6.3%, a difference of 0.16%), Hmong (6.3%, a difference of 0.29%), Scotch-Irish (6.3%, a difference of 0.32%), and Apache (6.4%, a difference of 0.38%).
| Demographics | Rating | Rank | Disability Age 5 to 17 |
| Natives/Alaskans | 0.0 /100 | #305 | Tragic 6.3% |
| Immigrants | Nonimmigrants | 0.0 /100 | #306 | Tragic 6.3% |
| Bahamians | 0.0 /100 | #307 | Tragic 6.3% |
| Scotch-Irish | 0.0 /100 | #308 | Tragic 6.3% |
| Hmong | 0.0 /100 | #309 | Tragic 6.3% |
| Alaskan Athabascans | 0.0 /100 | #310 | Tragic 6.3% |
| Immigrants | Dominica | 0.0 /100 | #311 | Tragic 6.3% |
| Bermudans | 0.0 /100 | #312 | Tragic 6.4% |
| Apache | 0.0 /100 | #313 | Tragic 6.4% |
| French | 0.0 /100 | #314 | Tragic 6.4% |
| Immigrants | Portugal | 0.0 /100 | #315 | Tragic 6.4% |
| Immigrants | Dominican Republic | 0.0 /100 | #316 | Tragic 6.4% |
| Kiowa | 0.0 /100 | #317 | Tragic 6.4% |
| Comanche | 0.0 /100 | #318 | Tragic 6.4% |
| Delaware | 0.0 /100 | #319 | Tragic 6.5% |
Demographics Similar to Scottish by Disability Age 5 to 17
In terms of disability age 5 to 17, the demographic groups most similar to Scottish are Portuguese (6.1%, a difference of 0.25%), German (6.1%, a difference of 0.25%), Immigrants from Jamaica (6.1%, a difference of 0.39%), Ugandan (6.2%, a difference of 0.41%), and Subsaharan African (6.2%, a difference of 0.44%).
| Demographics | Rating | Rank | Disability Age 5 to 17 |
| Cheyenne | 0.2 /100 | #274 | Tragic 6.0% |
| Dutch | 0.2 /100 | #275 | Tragic 6.0% |
| Japanese | 0.1 /100 | #276 | Tragic 6.1% |
| Puget Sound Salish | 0.1 /100 | #277 | Tragic 6.1% |
| Immigrants | Liberia | 0.1 /100 | #278 | Tragic 6.1% |
| Immigrants | Jamaica | 0.1 /100 | #279 | Tragic 6.1% |
| Portuguese | 0.1 /100 | #280 | Tragic 6.1% |
| Scottish | 0.0 /100 | #281 | Tragic 6.1% |
| Germans | 0.0 /100 | #282 | Tragic 6.1% |
| Ugandans | 0.0 /100 | #283 | Tragic 6.2% |
| Sub-Saharan Africans | 0.0 /100 | #284 | Tragic 6.2% |
| English | 0.0 /100 | #285 | Tragic 6.2% |
| Colville | 0.0 /100 | #286 | Tragic 6.2% |
| Pima | 0.0 /100 | #287 | Tragic 6.2% |
| Jamaicans | 0.0 /100 | #288 | Tragic 6.2% |