Bermudan vs Mongolian Disability Age 5 to 17
COMPARE
Bermudan
Mongolian
Disability Age 5 to 17
Disability Age 5 to 17 Comparison
Bermudans
Mongolians
6.4%
DISABILITY AGE 5 TO 17
0.0/ 100
METRIC RATING
312th/ 347
METRIC RANK
5.3%
DISABILITY AGE 5 TO 17
99.2/ 100
METRIC RATING
91st/ 347
METRIC RANK
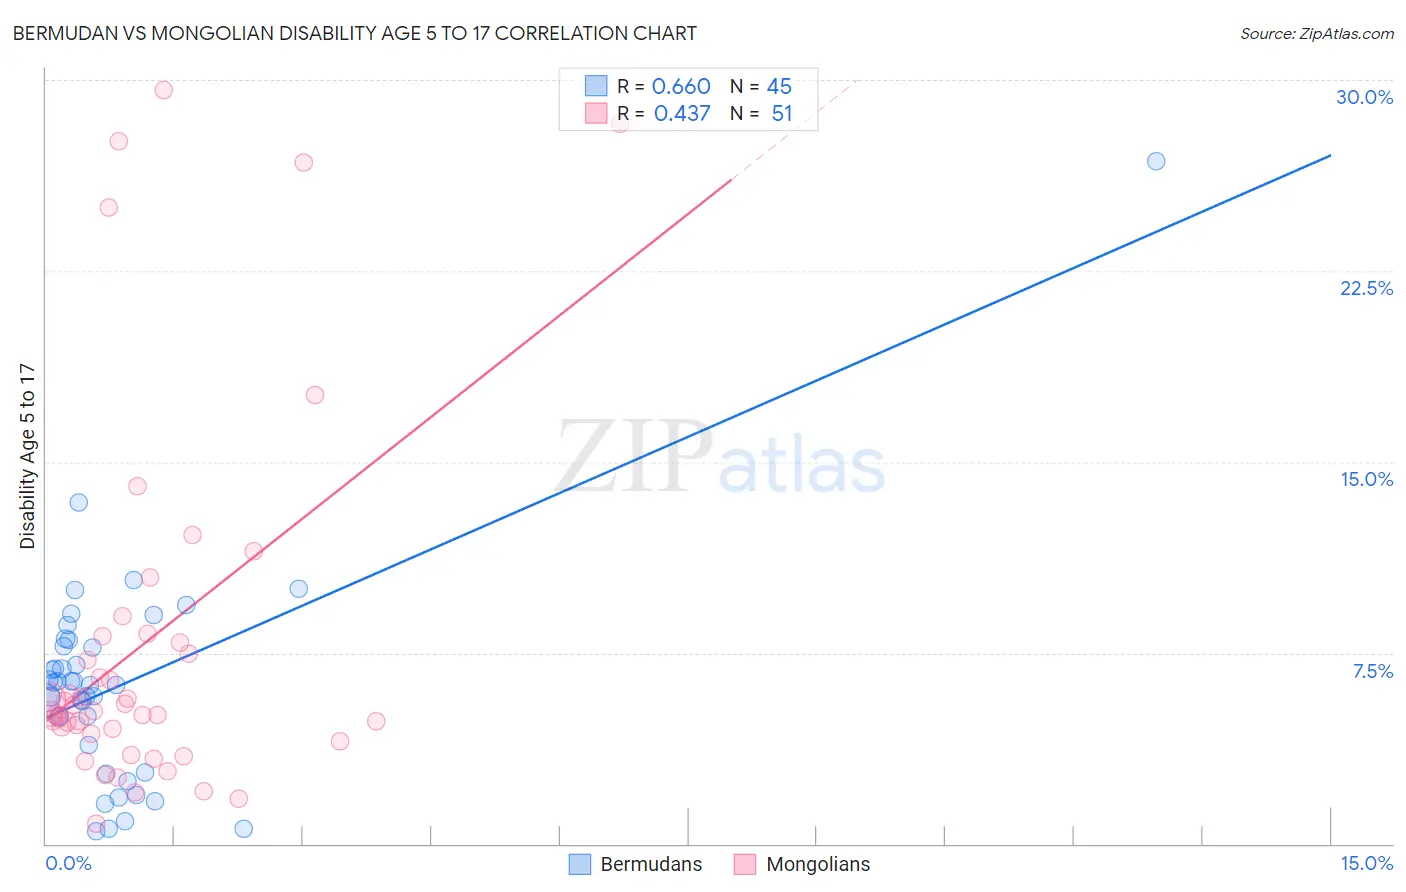
Bermudan vs Mongolian Disability Age 5 to 17 Correlation Chart
The statistical analysis conducted on geographies consisting of 55,645,998 people shows a significant positive correlation between the proportion of Bermudans and percentage of population with a disability between the ages 5 and 17 in the United States with a correlation coefficient (R) of 0.660 and weighted average of 6.4%. Similarly, the statistical analysis conducted on geographies consisting of 139,966,367 people shows a moderate positive correlation between the proportion of Mongolians and percentage of population with a disability between the ages 5 and 17 in the United States with a correlation coefficient (R) of 0.437 and weighted average of 5.3%, a difference of 20.7%.
Disability Age 5 to 17 Correlation Summary
| Measurement | Bermudan | Mongolian |
| Minimum | 0.50% | 0.80% |
| Maximum | 26.8% | 29.6% |
| Range | 26.3% | 28.8% |
| Mean | 6.2% | 7.9% |
| Median | 6.2% | 5.2% |
| Interquartile 25% (IQ1) | 3.3% | 4.3% |
| Interquartile 75% (IQ3) | 7.9% | 8.1% |
| Interquartile Range (IQR) | 4.5% | 3.8% |
| Standard Deviation (Sample) | 4.3% | 7.2% |
| Standard Deviation (Population) | 4.3% | 7.1% |
Similar Demographics by Disability Age 5 to 17
Demographics Similar to Bermudans by Disability Age 5 to 17
In terms of disability age 5 to 17, the demographic groups most similar to Bermudans are Immigrants from Dominica (6.3%, a difference of 0.12%), Alaskan Athabascan (6.3%, a difference of 0.16%), Hmong (6.3%, a difference of 0.29%), Scotch-Irish (6.3%, a difference of 0.32%), and Apache (6.4%, a difference of 0.38%).
| Demographics | Rating | Rank | Disability Age 5 to 17 |
| Natives/Alaskans | 0.0 /100 | #305 | Tragic 6.3% |
| Immigrants | Nonimmigrants | 0.0 /100 | #306 | Tragic 6.3% |
| Bahamians | 0.0 /100 | #307 | Tragic 6.3% |
| Scotch-Irish | 0.0 /100 | #308 | Tragic 6.3% |
| Hmong | 0.0 /100 | #309 | Tragic 6.3% |
| Alaskan Athabascans | 0.0 /100 | #310 | Tragic 6.3% |
| Immigrants | Dominica | 0.0 /100 | #311 | Tragic 6.3% |
| Bermudans | 0.0 /100 | #312 | Tragic 6.4% |
| Apache | 0.0 /100 | #313 | Tragic 6.4% |
| French | 0.0 /100 | #314 | Tragic 6.4% |
| Immigrants | Portugal | 0.0 /100 | #315 | Tragic 6.4% |
| Immigrants | Dominican Republic | 0.0 /100 | #316 | Tragic 6.4% |
| Kiowa | 0.0 /100 | #317 | Tragic 6.4% |
| Comanche | 0.0 /100 | #318 | Tragic 6.4% |
| Delaware | 0.0 /100 | #319 | Tragic 6.5% |
Demographics Similar to Mongolians by Disability Age 5 to 17
In terms of disability age 5 to 17, the demographic groups most similar to Mongolians are Luxembourger (5.3%, a difference of 0.010%), Immigrants from Peru (5.3%, a difference of 0.090%), Immigrants from Jordan (5.3%, a difference of 0.16%), Immigrants from Grenada (5.3%, a difference of 0.18%), and Immigrants from Kuwait (5.3%, a difference of 0.29%).
| Demographics | Rating | Rank | Disability Age 5 to 17 |
| Immigrants | Nicaragua | 99.5 /100 | #84 | Exceptional 5.2% |
| Bulgarians | 99.4 /100 | #85 | Exceptional 5.2% |
| Immigrants | St. Vincent and the Grenadines | 99.4 /100 | #86 | Exceptional 5.2% |
| Eastern Europeans | 99.4 /100 | #87 | Exceptional 5.2% |
| Immigrants | Croatia | 99.4 /100 | #88 | Exceptional 5.2% |
| Immigrants | Spain | 99.4 /100 | #89 | Exceptional 5.2% |
| Immigrants | Kuwait | 99.4 /100 | #90 | Exceptional 5.3% |
| Mongolians | 99.2 /100 | #91 | Exceptional 5.3% |
| Luxembourgers | 99.2 /100 | #92 | Exceptional 5.3% |
| Immigrants | Peru | 99.1 /100 | #93 | Exceptional 5.3% |
| Immigrants | Jordan | 99.1 /100 | #94 | Exceptional 5.3% |
| Immigrants | Grenada | 99.1 /100 | #95 | Exceptional 5.3% |
| Immigrants | El Salvador | 99.0 /100 | #96 | Exceptional 5.3% |
| Immigrants | Europe | 99.0 /100 | #97 | Exceptional 5.3% |
| Immigrants | Austria | 98.9 /100 | #98 | Exceptional 5.3% |