Lithuanian vs Scottish Disability Age 5 to 17
COMPARE
Lithuanian
Scottish
Disability Age 5 to 17
Disability Age 5 to 17 Comparison
Lithuanians
Scottish
5.8%
DISABILITY AGE 5 TO 17
6.7/ 100
METRIC RATING
221st/ 347
METRIC RANK
6.1%
DISABILITY AGE 5 TO 17
0.0/ 100
METRIC RATING
281st/ 347
METRIC RANK
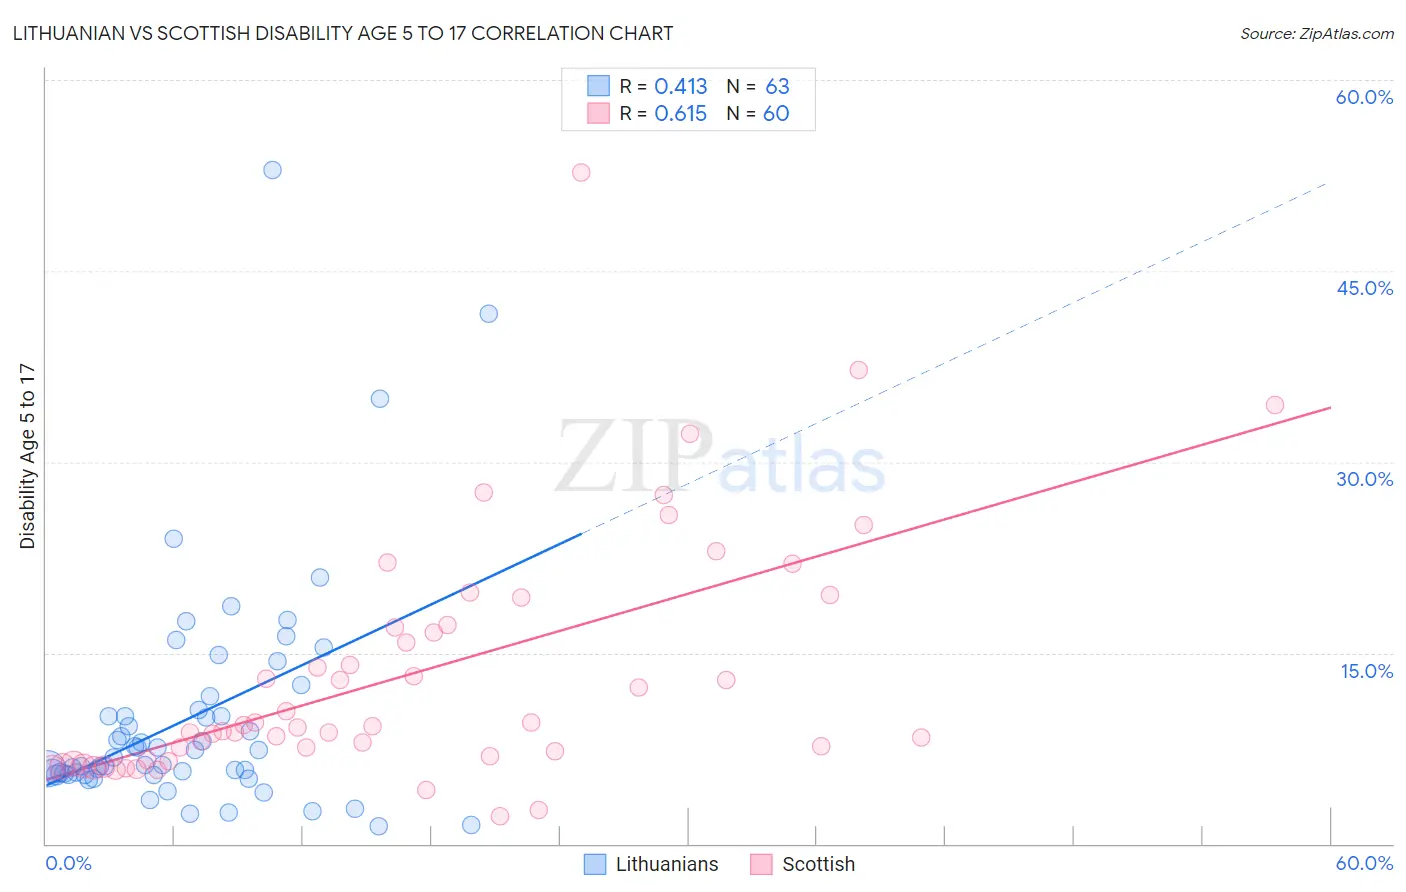
Lithuanian vs Scottish Disability Age 5 to 17 Correlation Chart
The statistical analysis conducted on geographies consisting of 416,867,041 people shows a moderate positive correlation between the proportion of Lithuanians and percentage of population with a disability between the ages 5 and 17 in the United States with a correlation coefficient (R) of 0.413 and weighted average of 5.8%. Similarly, the statistical analysis conducted on geographies consisting of 553,365,795 people shows a significant positive correlation between the proportion of Scottish and percentage of population with a disability between the ages 5 and 17 in the United States with a correlation coefficient (R) of 0.615 and weighted average of 6.1%, a difference of 6.1%.
Disability Age 5 to 17 Correlation Summary
| Measurement | Lithuanian | Scottish |
| Minimum | 1.4% | 2.1% |
| Maximum | 52.9% | 52.7% |
| Range | 51.6% | 50.6% |
| Mean | 9.9% | 13.3% |
| Median | 6.7% | 9.1% |
| Interquartile 25% (IQ1) | 5.4% | 6.8% |
| Interquartile 75% (IQ3) | 10.5% | 17.1% |
| Interquartile Range (IQR) | 5.0% | 10.3% |
| Standard Deviation (Sample) | 9.1% | 9.6% |
| Standard Deviation (Population) | 9.0% | 9.5% |
Similar Demographics by Disability Age 5 to 17
Demographics Similar to Lithuanians by Disability Age 5 to 17
In terms of disability age 5 to 17, the demographic groups most similar to Lithuanians are Immigrants from Sudan (5.8%, a difference of 0.0%), Belgian (5.8%, a difference of 0.040%), Sierra Leonean (5.8%, a difference of 0.050%), Immigrants from Sierra Leone (5.8%, a difference of 0.070%), and Czech (5.8%, a difference of 0.12%).
| Demographics | Rating | Rank | Disability Age 5 to 17 |
| Immigrants | Morocco | 8.3 /100 | #214 | Tragic 5.8% |
| Swedes | 8.1 /100 | #215 | Tragic 5.8% |
| Nigerians | 7.5 /100 | #216 | Tragic 5.8% |
| Czechs | 7.4 /100 | #217 | Tragic 5.8% |
| Immigrants | Sierra Leone | 7.1 /100 | #218 | Tragic 5.8% |
| Sierra Leoneans | 7.0 /100 | #219 | Tragic 5.8% |
| Belgians | 6.9 /100 | #220 | Tragic 5.8% |
| Lithuanians | 6.7 /100 | #221 | Tragic 5.8% |
| Immigrants | Sudan | 6.7 /100 | #222 | Tragic 5.8% |
| Alsatians | 6.0 /100 | #223 | Tragic 5.8% |
| Mexicans | 5.7 /100 | #224 | Tragic 5.8% |
| Guamanians/Chamorros | 5.6 /100 | #225 | Tragic 5.8% |
| British West Indians | 5.4 /100 | #226 | Tragic 5.8% |
| Swiss | 5.1 /100 | #227 | Tragic 5.8% |
| Haitians | 4.8 /100 | #228 | Tragic 5.8% |
Demographics Similar to Scottish by Disability Age 5 to 17
In terms of disability age 5 to 17, the demographic groups most similar to Scottish are Portuguese (6.1%, a difference of 0.25%), German (6.1%, a difference of 0.25%), Immigrants from Jamaica (6.1%, a difference of 0.39%), Ugandan (6.2%, a difference of 0.41%), and Subsaharan African (6.2%, a difference of 0.44%).
| Demographics | Rating | Rank | Disability Age 5 to 17 |
| Cheyenne | 0.2 /100 | #274 | Tragic 6.0% |
| Dutch | 0.2 /100 | #275 | Tragic 6.0% |
| Japanese | 0.1 /100 | #276 | Tragic 6.1% |
| Puget Sound Salish | 0.1 /100 | #277 | Tragic 6.1% |
| Immigrants | Liberia | 0.1 /100 | #278 | Tragic 6.1% |
| Immigrants | Jamaica | 0.1 /100 | #279 | Tragic 6.1% |
| Portuguese | 0.1 /100 | #280 | Tragic 6.1% |
| Scottish | 0.0 /100 | #281 | Tragic 6.1% |
| Germans | 0.0 /100 | #282 | Tragic 6.1% |
| Ugandans | 0.0 /100 | #283 | Tragic 6.2% |
| Sub-Saharan Africans | 0.0 /100 | #284 | Tragic 6.2% |
| English | 0.0 /100 | #285 | Tragic 6.2% |
| Colville | 0.0 /100 | #286 | Tragic 6.2% |
| Pima | 0.0 /100 | #287 | Tragic 6.2% |
| Jamaicans | 0.0 /100 | #288 | Tragic 6.2% |