Immigrants from Costa Rica vs Scottish Disability Age 5 to 17
COMPARE
Immigrants from Costa Rica
Scottish
Disability Age 5 to 17
Disability Age 5 to 17 Comparison
Immigrants from Costa Rica
Scottish
5.5%
DISABILITY AGE 5 TO 17
77.9/ 100
METRIC RATING
157th/ 347
METRIC RANK
6.1%
DISABILITY AGE 5 TO 17
0.0/ 100
METRIC RATING
281st/ 347
METRIC RANK
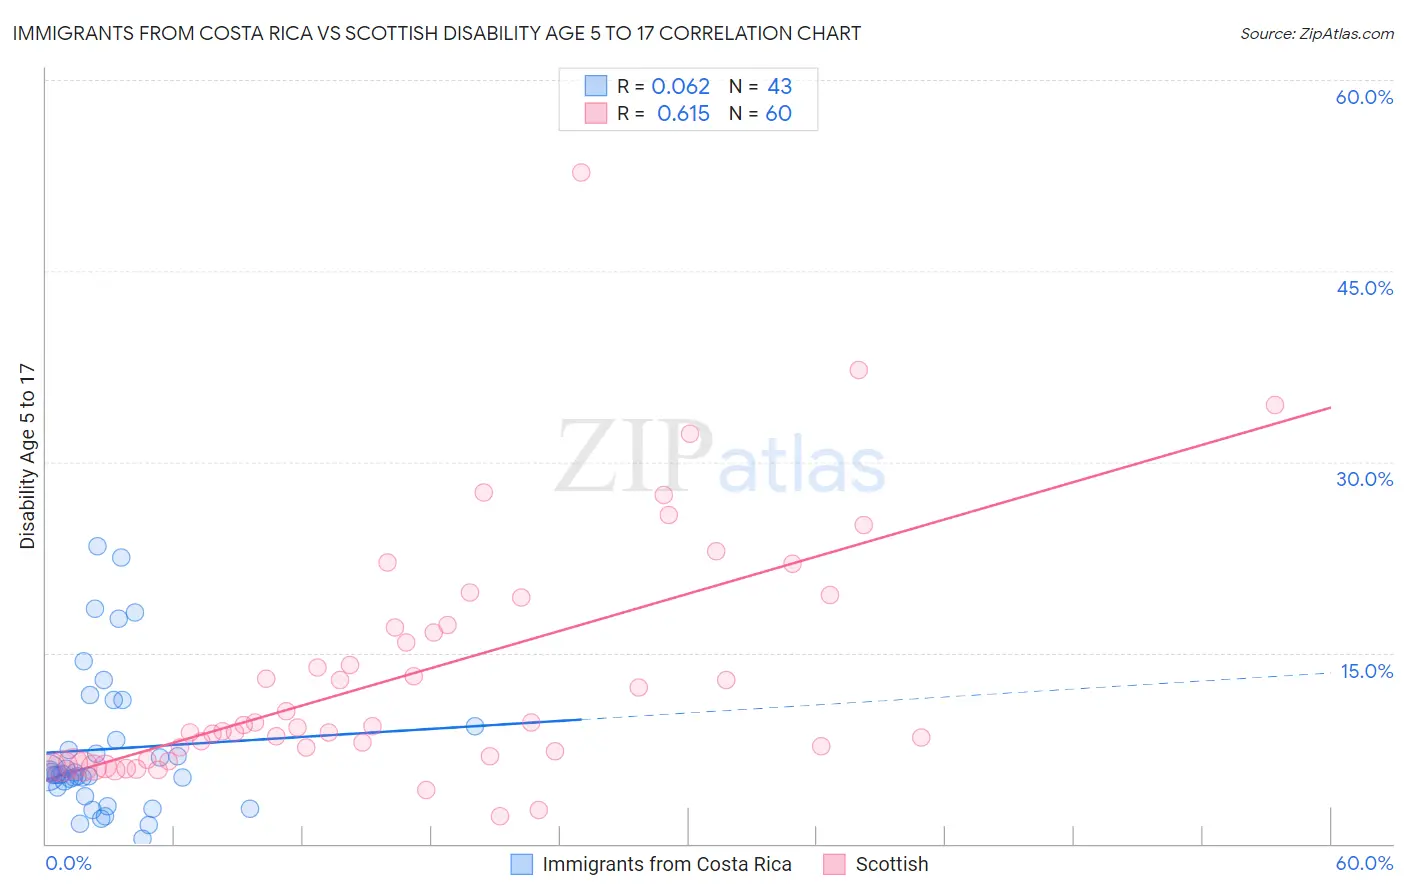
Immigrants from Costa Rica vs Scottish Disability Age 5 to 17 Correlation Chart
The statistical analysis conducted on geographies consisting of 203,667,525 people shows a slight positive correlation between the proportion of Immigrants from Costa Rica and percentage of population with a disability between the ages 5 and 17 in the United States with a correlation coefficient (R) of 0.062 and weighted average of 5.5%. Similarly, the statistical analysis conducted on geographies consisting of 553,365,795 people shows a significant positive correlation between the proportion of Scottish and percentage of population with a disability between the ages 5 and 17 in the United States with a correlation coefficient (R) of 0.615 and weighted average of 6.1%, a difference of 11.3%.
Disability Age 5 to 17 Correlation Summary
| Measurement | Immigrants from Costa Rica | Scottish |
| Minimum | 0.44% | 2.1% |
| Maximum | 23.3% | 52.7% |
| Range | 22.9% | 50.6% |
| Mean | 7.4% | 13.3% |
| Median | 5.5% | 9.1% |
| Interquartile 25% (IQ1) | 4.4% | 6.8% |
| Interquartile 75% (IQ3) | 9.3% | 17.1% |
| Interquartile Range (IQR) | 4.9% | 10.3% |
| Standard Deviation (Sample) | 5.6% | 9.6% |
| Standard Deviation (Population) | 5.5% | 9.5% |
Similar Demographics by Disability Age 5 to 17
Demographics Similar to Immigrants from Costa Rica by Disability Age 5 to 17
In terms of disability age 5 to 17, the demographic groups most similar to Immigrants from Costa Rica are Hawaiian (5.5%, a difference of 0.010%), Immigrants from Ecuador (5.5%, a difference of 0.030%), Immigrants from Nepal (5.5%, a difference of 0.050%), Australian (5.5%, a difference of 0.070%), and Ecuadorian (5.5%, a difference of 0.14%).
| Demographics | Rating | Rank | Disability Age 5 to 17 |
| Guatemalans | 81.5 /100 | #150 | Excellent 5.5% |
| Estonians | 80.8 /100 | #151 | Excellent 5.5% |
| Ute | 80.6 /100 | #152 | Excellent 5.5% |
| Ecuadorians | 79.7 /100 | #153 | Good 5.5% |
| Australians | 78.8 /100 | #154 | Good 5.5% |
| Immigrants | Ecuador | 78.3 /100 | #155 | Good 5.5% |
| Hawaiians | 78.0 /100 | #156 | Good 5.5% |
| Immigrants | Costa Rica | 77.9 /100 | #157 | Good 5.5% |
| Immigrants | Nepal | 77.1 /100 | #158 | Good 5.5% |
| Immigrants | Zimbabwe | 75.3 /100 | #159 | Good 5.5% |
| South Africans | 73.3 /100 | #160 | Good 5.5% |
| Immigrants | Saudi Arabia | 69.1 /100 | #161 | Good 5.5% |
| Zimbabweans | 67.2 /100 | #162 | Good 5.5% |
| Immigrants | Southern Europe | 64.0 /100 | #163 | Good 5.6% |
| Immigrants | Scotland | 61.9 /100 | #164 | Good 5.6% |
Demographics Similar to Scottish by Disability Age 5 to 17
In terms of disability age 5 to 17, the demographic groups most similar to Scottish are Portuguese (6.1%, a difference of 0.25%), German (6.1%, a difference of 0.25%), Immigrants from Jamaica (6.1%, a difference of 0.39%), Ugandan (6.2%, a difference of 0.41%), and Subsaharan African (6.2%, a difference of 0.44%).
| Demographics | Rating | Rank | Disability Age 5 to 17 |
| Cheyenne | 0.2 /100 | #274 | Tragic 6.0% |
| Dutch | 0.2 /100 | #275 | Tragic 6.0% |
| Japanese | 0.1 /100 | #276 | Tragic 6.1% |
| Puget Sound Salish | 0.1 /100 | #277 | Tragic 6.1% |
| Immigrants | Liberia | 0.1 /100 | #278 | Tragic 6.1% |
| Immigrants | Jamaica | 0.1 /100 | #279 | Tragic 6.1% |
| Portuguese | 0.1 /100 | #280 | Tragic 6.1% |
| Scottish | 0.0 /100 | #281 | Tragic 6.1% |
| Germans | 0.0 /100 | #282 | Tragic 6.1% |
| Ugandans | 0.0 /100 | #283 | Tragic 6.2% |
| Sub-Saharan Africans | 0.0 /100 | #284 | Tragic 6.2% |
| English | 0.0 /100 | #285 | Tragic 6.2% |
| Colville | 0.0 /100 | #286 | Tragic 6.2% |
| Pima | 0.0 /100 | #287 | Tragic 6.2% |
| Jamaicans | 0.0 /100 | #288 | Tragic 6.2% |