Bermudan vs Scottish In Labor Force | Age 20-64
COMPARE
Bermudan
Scottish
In Labor Force | Age 20-64
In Labor Force | Age 20-64 Comparison
Bermudans
Scottish
80.0%
IN LABOR FORCE | AGE 20-64
93.3/ 100
METRIC RATING
115th/ 347
METRIC RANK
78.9%
IN LABOR FORCE | AGE 20-64
1.3/ 100
METRIC RATING
245th/ 347
METRIC RANK
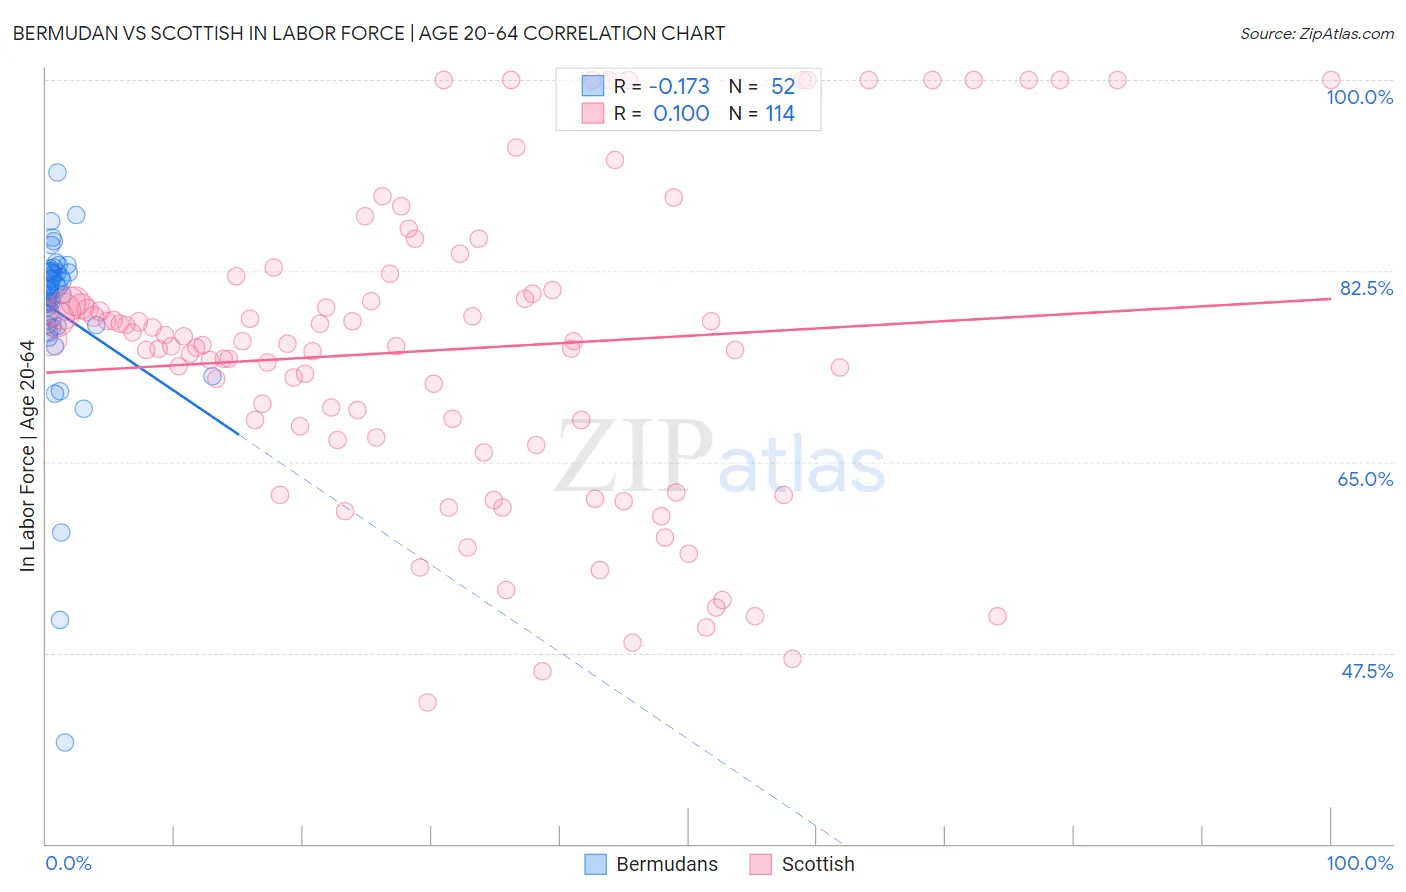
Bermudan vs Scottish In Labor Force | Age 20-64 Correlation Chart
The statistical analysis conducted on geographies consisting of 55,730,379 people shows a poor negative correlation between the proportion of Bermudans and labor force participation rate among population between the ages 20 and 64 in the United States with a correlation coefficient (R) of -0.173 and weighted average of 80.0%. Similarly, the statistical analysis conducted on geographies consisting of 567,150,822 people shows a poor positive correlation between the proportion of Scottish and labor force participation rate among population between the ages 20 and 64 in the United States with a correlation coefficient (R) of 0.100 and weighted average of 78.9%, a difference of 1.4%.
In Labor Force | Age 20-64 Correlation Summary
| Measurement | Bermudan | Scottish |
| Minimum | 39.3% | 42.9% |
| Maximum | 91.5% | 100.0% |
| Range | 52.2% | 57.1% |
| Mean | 78.7% | 75.3% |
| Median | 80.7% | 75.9% |
| Interquartile 25% (IQ1) | 77.5% | 67.3% |
| Interquartile 75% (IQ3) | 82.4% | 80.4% |
| Interquartile Range (IQR) | 4.9% | 13.2% |
| Standard Deviation (Sample) | 8.5% | 13.9% |
| Standard Deviation (Population) | 8.4% | 13.9% |
Similar Demographics by In Labor Force | Age 20-64
Demographics Similar to Bermudans by In Labor Force | Age 20-64
In terms of in labor force | age 20-64, the demographic groups most similar to Bermudans are Immigrants from Western Africa (80.0%, a difference of 0.010%), Estonian (80.0%, a difference of 0.020%), Immigrants from South America (80.0%, a difference of 0.020%), Immigrants from Italy (80.0%, a difference of 0.020%), and Sri Lankan (80.0%, a difference of 0.020%).
| Demographics | Rating | Rank | In Labor Force | Age 20-64 |
| Iranians | 94.3 /100 | #108 | Exceptional 80.0% |
| Immigrants | Argentina | 94.1 /100 | #109 | Exceptional 80.0% |
| Estonians | 94.0 /100 | #110 | Exceptional 80.0% |
| Immigrants | South America | 93.9 /100 | #111 | Exceptional 80.0% |
| Immigrants | Italy | 93.9 /100 | #112 | Exceptional 80.0% |
| Sri Lankans | 93.9 /100 | #113 | Exceptional 80.0% |
| Argentineans | 93.8 /100 | #114 | Exceptional 80.0% |
| Bermudans | 93.3 /100 | #115 | Exceptional 80.0% |
| Immigrants | Western Africa | 93.1 /100 | #116 | Exceptional 80.0% |
| Immigrants | Vietnam | 92.7 /100 | #117 | Exceptional 80.0% |
| Cape Verdeans | 92.7 /100 | #118 | Exceptional 80.0% |
| Immigrants | Taiwan | 92.5 /100 | #119 | Exceptional 80.0% |
| Maltese | 92.4 /100 | #120 | Exceptional 80.0% |
| Immigrants | Kuwait | 92.2 /100 | #121 | Exceptional 80.0% |
| Mongolians | 92.0 /100 | #122 | Exceptional 79.9% |
Demographics Similar to Scottish by In Labor Force | Age 20-64
In terms of in labor force | age 20-64, the demographic groups most similar to Scottish are Immigrants from Trinidad and Tobago (78.8%, a difference of 0.030%), French (78.9%, a difference of 0.040%), Immigrants from Germany (78.8%, a difference of 0.040%), Immigrants from Caribbean (78.8%, a difference of 0.050%), and Immigrants from West Indies (78.9%, a difference of 0.070%).
| Demographics | Rating | Rank | In Labor Force | Age 20-64 |
| Immigrants | Jamaica | 2.6 /100 | #238 | Tragic 79.0% |
| Welsh | 2.4 /100 | #239 | Tragic 79.0% |
| Trinidadians and Tobagonians | 2.3 /100 | #240 | Tragic 79.0% |
| Jamaicans | 2.0 /100 | #241 | Tragic 78.9% |
| Immigrants | Micronesia | 1.9 /100 | #242 | Tragic 78.9% |
| Immigrants | West Indies | 1.7 /100 | #243 | Tragic 78.9% |
| French | 1.5 /100 | #244 | Tragic 78.9% |
| Scottish | 1.3 /100 | #245 | Tragic 78.9% |
| Immigrants | Trinidad and Tobago | 1.1 /100 | #246 | Tragic 78.8% |
| Immigrants | Germany | 1.0 /100 | #247 | Tragic 78.8% |
| Immigrants | Caribbean | 1.0 /100 | #248 | Tragic 78.8% |
| English | 0.9 /100 | #249 | Tragic 78.8% |
| Hondurans | 0.8 /100 | #250 | Tragic 78.8% |
| Barbadians | 0.7 /100 | #251 | Tragic 78.8% |
| Immigrants | Honduras | 0.6 /100 | #252 | Tragic 78.7% |