Immigrants from Belize vs Scottish Disability Age 5 to 17
COMPARE
Immigrants from Belize
Scottish
Disability Age 5 to 17
Disability Age 5 to 17 Comparison
Immigrants from Belize
Scottish
5.4%
DISABILITY AGE 5 TO 17
91.7/ 100
METRIC RATING
135th/ 347
METRIC RANK
6.1%
DISABILITY AGE 5 TO 17
0.0/ 100
METRIC RATING
281st/ 347
METRIC RANK
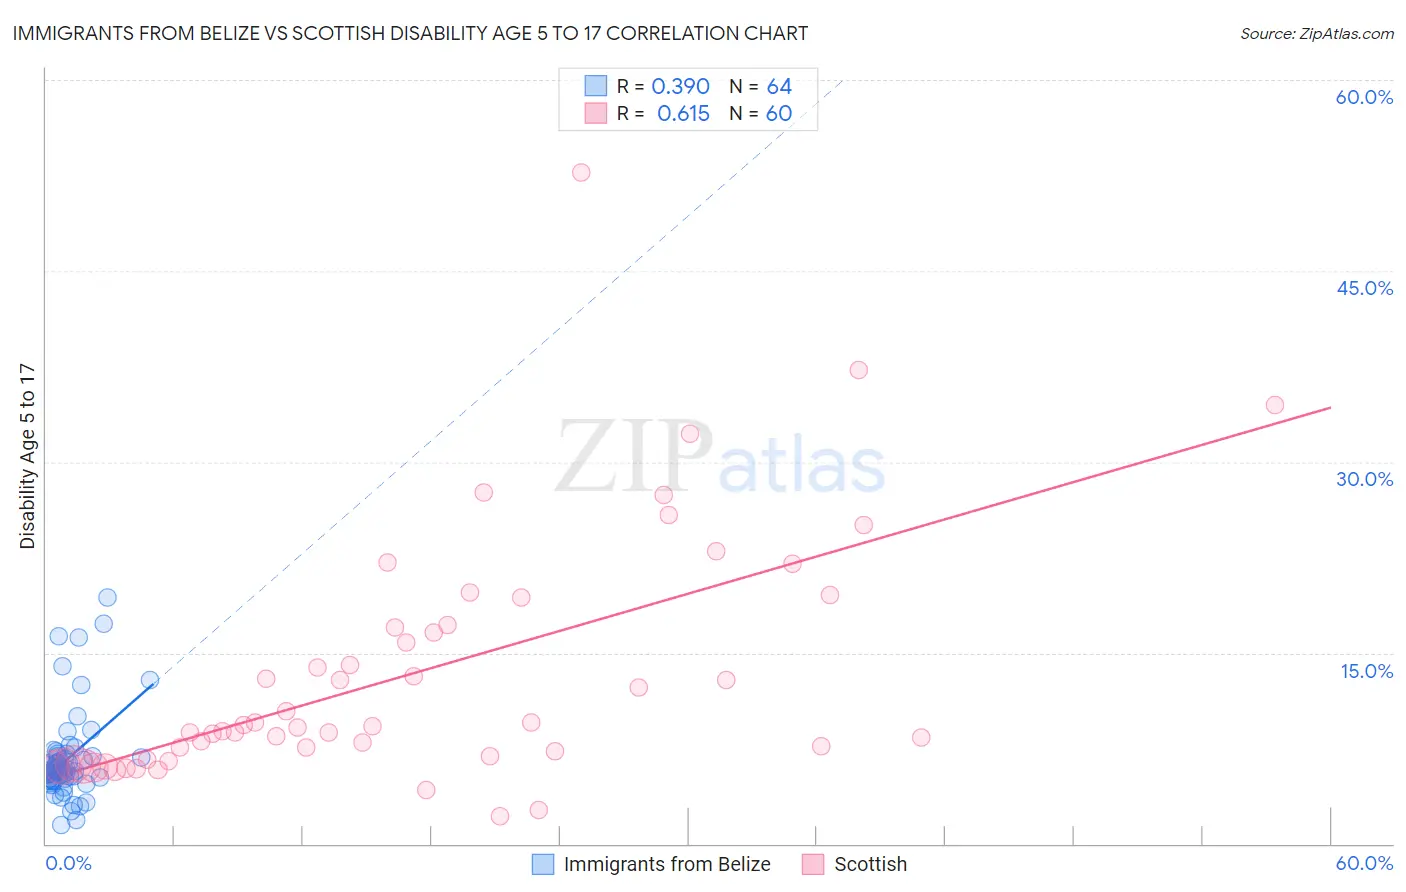
Immigrants from Belize vs Scottish Disability Age 5 to 17 Correlation Chart
The statistical analysis conducted on geographies consisting of 129,905,641 people shows a mild positive correlation between the proportion of Immigrants from Belize and percentage of population with a disability between the ages 5 and 17 in the United States with a correlation coefficient (R) of 0.390 and weighted average of 5.4%. Similarly, the statistical analysis conducted on geographies consisting of 553,365,795 people shows a significant positive correlation between the proportion of Scottish and percentage of population with a disability between the ages 5 and 17 in the United States with a correlation coefficient (R) of 0.615 and weighted average of 6.1%, a difference of 12.9%.
Disability Age 5 to 17 Correlation Summary
| Measurement | Immigrants from Belize | Scottish |
| Minimum | 1.4% | 2.1% |
| Maximum | 19.4% | 52.7% |
| Range | 17.9% | 50.6% |
| Mean | 6.7% | 13.3% |
| Median | 5.8% | 9.1% |
| Interquartile 25% (IQ1) | 5.1% | 6.8% |
| Interquartile 75% (IQ3) | 7.0% | 17.1% |
| Interquartile Range (IQR) | 1.9% | 10.3% |
| Standard Deviation (Sample) | 3.5% | 9.6% |
| Standard Deviation (Population) | 3.5% | 9.5% |
Similar Demographics by Disability Age 5 to 17
Demographics Similar to Immigrants from Belize by Disability Age 5 to 17
In terms of disability age 5 to 17, the demographic groups most similar to Immigrants from Belize are Immigrants from Denmark (5.4%, a difference of 0.050%), Yuman (5.4%, a difference of 0.10%), Navajo (5.4%, a difference of 0.13%), Immigrants from Oceania (5.4%, a difference of 0.14%), and Belizean (5.4%, a difference of 0.14%).
| Demographics | Rating | Rank | Disability Age 5 to 17 |
| Immigrants | Venezuela | 94.5 /100 | #128 | Exceptional 5.4% |
| Romanians | 94.1 /100 | #129 | Exceptional 5.4% |
| Immigrants | Bulgaria | 94.0 /100 | #130 | Exceptional 5.4% |
| Arabs | 92.9 /100 | #131 | Exceptional 5.4% |
| Immigrants | Colombia | 92.9 /100 | #132 | Exceptional 5.4% |
| Venezuelans | 92.7 /100 | #133 | Exceptional 5.4% |
| Yuman | 92.3 /100 | #134 | Exceptional 5.4% |
| Immigrants | Belize | 91.7 /100 | #135 | Exceptional 5.4% |
| Immigrants | Denmark | 91.4 /100 | #136 | Exceptional 5.4% |
| Navajo | 90.9 /100 | #137 | Exceptional 5.4% |
| Immigrants | Oceania | 90.8 /100 | #138 | Exceptional 5.4% |
| Belizeans | 90.8 /100 | #139 | Exceptional 5.4% |
| Immigrants | Netherlands | 90.5 /100 | #140 | Exceptional 5.4% |
| South American Indians | 89.3 /100 | #141 | Excellent 5.5% |
| Colombians | 88.0 /100 | #142 | Excellent 5.5% |
Demographics Similar to Scottish by Disability Age 5 to 17
In terms of disability age 5 to 17, the demographic groups most similar to Scottish are Portuguese (6.1%, a difference of 0.25%), German (6.1%, a difference of 0.25%), Immigrants from Jamaica (6.1%, a difference of 0.39%), Ugandan (6.2%, a difference of 0.41%), and Subsaharan African (6.2%, a difference of 0.44%).
| Demographics | Rating | Rank | Disability Age 5 to 17 |
| Cheyenne | 0.2 /100 | #274 | Tragic 6.0% |
| Dutch | 0.2 /100 | #275 | Tragic 6.0% |
| Japanese | 0.1 /100 | #276 | Tragic 6.1% |
| Puget Sound Salish | 0.1 /100 | #277 | Tragic 6.1% |
| Immigrants | Liberia | 0.1 /100 | #278 | Tragic 6.1% |
| Immigrants | Jamaica | 0.1 /100 | #279 | Tragic 6.1% |
| Portuguese | 0.1 /100 | #280 | Tragic 6.1% |
| Scottish | 0.0 /100 | #281 | Tragic 6.1% |
| Germans | 0.0 /100 | #282 | Tragic 6.1% |
| Ugandans | 0.0 /100 | #283 | Tragic 6.2% |
| Sub-Saharan Africans | 0.0 /100 | #284 | Tragic 6.2% |
| English | 0.0 /100 | #285 | Tragic 6.2% |
| Colville | 0.0 /100 | #286 | Tragic 6.2% |
| Pima | 0.0 /100 | #287 | Tragic 6.2% |
| Jamaicans | 0.0 /100 | #288 | Tragic 6.2% |