Bermudan vs Macedonian Disability Age 5 to 17
COMPARE
Bermudan
Macedonian
Disability Age 5 to 17
Disability Age 5 to 17 Comparison
Bermudans
Macedonians
6.4%
DISABILITY AGE 5 TO 17
0.0/ 100
METRIC RATING
312th/ 347
METRIC RANK
5.2%
DISABILITY AGE 5 TO 17
99.8/ 100
METRIC RATING
67th/ 347
METRIC RANK
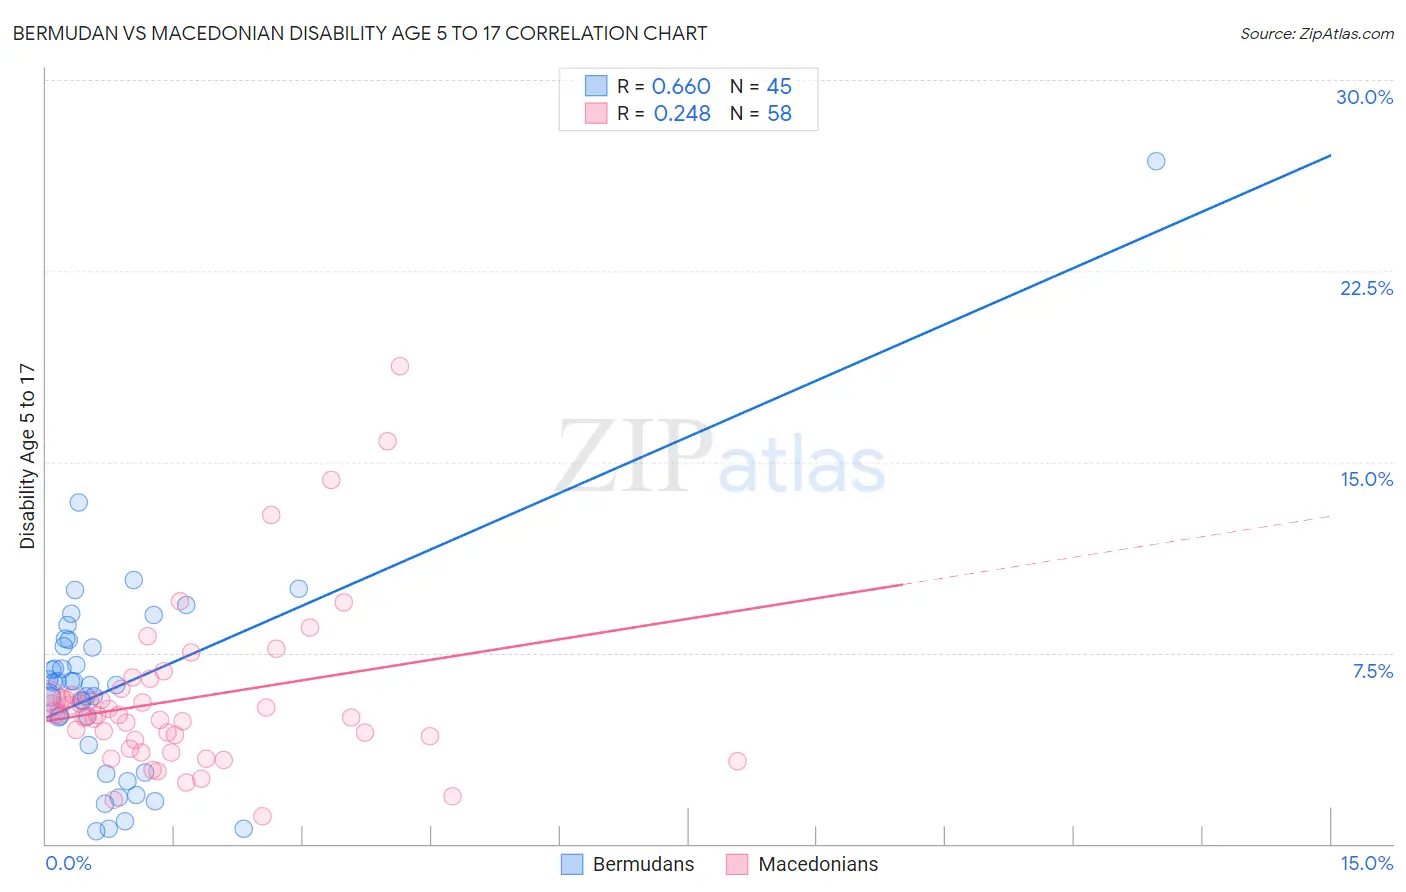
Bermudan vs Macedonian Disability Age 5 to 17 Correlation Chart
The statistical analysis conducted on geographies consisting of 55,645,998 people shows a significant positive correlation between the proportion of Bermudans and percentage of population with a disability between the ages 5 and 17 in the United States with a correlation coefficient (R) of 0.660 and weighted average of 6.4%. Similarly, the statistical analysis conducted on geographies consisting of 132,067,299 people shows a weak positive correlation between the proportion of Macedonians and percentage of population with a disability between the ages 5 and 17 in the United States with a correlation coefficient (R) of 0.248 and weighted average of 5.2%, a difference of 22.7%.
Disability Age 5 to 17 Correlation Summary
| Measurement | Bermudan | Macedonian |
| Minimum | 0.50% | 1.1% |
| Maximum | 26.8% | 18.8% |
| Range | 26.3% | 17.7% |
| Mean | 6.2% | 5.7% |
| Median | 6.2% | 5.1% |
| Interquartile 25% (IQ1) | 3.3% | 4.1% |
| Interquartile 75% (IQ3) | 7.9% | 5.9% |
| Interquartile Range (IQR) | 4.5% | 1.8% |
| Standard Deviation (Sample) | 4.3% | 3.2% |
| Standard Deviation (Population) | 4.3% | 3.2% |
Similar Demographics by Disability Age 5 to 17
Demographics Similar to Bermudans by Disability Age 5 to 17
In terms of disability age 5 to 17, the demographic groups most similar to Bermudans are Immigrants from Dominica (6.3%, a difference of 0.12%), Alaskan Athabascan (6.3%, a difference of 0.16%), Hmong (6.3%, a difference of 0.29%), Scotch-Irish (6.3%, a difference of 0.32%), and Apache (6.4%, a difference of 0.38%).
| Demographics | Rating | Rank | Disability Age 5 to 17 |
| Natives/Alaskans | 0.0 /100 | #305 | Tragic 6.3% |
| Immigrants | Nonimmigrants | 0.0 /100 | #306 | Tragic 6.3% |
| Bahamians | 0.0 /100 | #307 | Tragic 6.3% |
| Scotch-Irish | 0.0 /100 | #308 | Tragic 6.3% |
| Hmong | 0.0 /100 | #309 | Tragic 6.3% |
| Alaskan Athabascans | 0.0 /100 | #310 | Tragic 6.3% |
| Immigrants | Dominica | 0.0 /100 | #311 | Tragic 6.3% |
| Bermudans | 0.0 /100 | #312 | Tragic 6.4% |
| Apache | 0.0 /100 | #313 | Tragic 6.4% |
| French | 0.0 /100 | #314 | Tragic 6.4% |
| Immigrants | Portugal | 0.0 /100 | #315 | Tragic 6.4% |
| Immigrants | Dominican Republic | 0.0 /100 | #316 | Tragic 6.4% |
| Kiowa | 0.0 /100 | #317 | Tragic 6.4% |
| Comanche | 0.0 /100 | #318 | Tragic 6.4% |
| Delaware | 0.0 /100 | #319 | Tragic 6.5% |
Demographics Similar to Macedonians by Disability Age 5 to 17
In terms of disability age 5 to 17, the demographic groups most similar to Macedonians are Palestinian (5.2%, a difference of 0.030%), Immigrants from Greece (5.2%, a difference of 0.070%), Immigrants from South Eastern Asia (5.2%, a difference of 0.080%), Immigrants from Bangladesh (5.2%, a difference of 0.11%), and Immigrants from Syria (5.2%, a difference of 0.14%).
| Demographics | Rating | Rank | Disability Age 5 to 17 |
| Immigrants | Eastern Europe | 99.9 /100 | #60 | Exceptional 5.1% |
| Immigrants | Switzerland | 99.8 /100 | #61 | Exceptional 5.2% |
| Immigrants | Ireland | 99.8 /100 | #62 | Exceptional 5.2% |
| Immigrants | Bangladesh | 99.8 /100 | #63 | Exceptional 5.2% |
| Immigrants | South Eastern Asia | 99.8 /100 | #64 | Exceptional 5.2% |
| Immigrants | Greece | 99.8 /100 | #65 | Exceptional 5.2% |
| Palestinians | 99.8 /100 | #66 | Exceptional 5.2% |
| Macedonians | 99.8 /100 | #67 | Exceptional 5.2% |
| Immigrants | Syria | 99.7 /100 | #68 | Exceptional 5.2% |
| Guyanese | 99.7 /100 | #69 | Exceptional 5.2% |
| Immigrants | Belgium | 99.7 /100 | #70 | Exceptional 5.2% |
| Jordanians | 99.7 /100 | #71 | Exceptional 5.2% |
| Immigrants | Vietnam | 99.7 /100 | #72 | Exceptional 5.2% |
| Immigrants | Czechoslovakia | 99.7 /100 | #73 | Exceptional 5.2% |
| Immigrants | Romania | 99.7 /100 | #74 | Exceptional 5.2% |