Immigrants from Burma/Myanmar vs Scottish Disability Age 5 to 17
COMPARE
Immigrants from Burma/Myanmar
Scottish
Disability Age 5 to 17
Disability Age 5 to 17 Comparison
Immigrants from Burma/Myanmar
Scottish
5.6%
DISABILITY AGE 5 TO 17
59.3/ 100
METRIC RATING
167th/ 347
METRIC RANK
6.1%
DISABILITY AGE 5 TO 17
0.0/ 100
METRIC RATING
281st/ 347
METRIC RANK
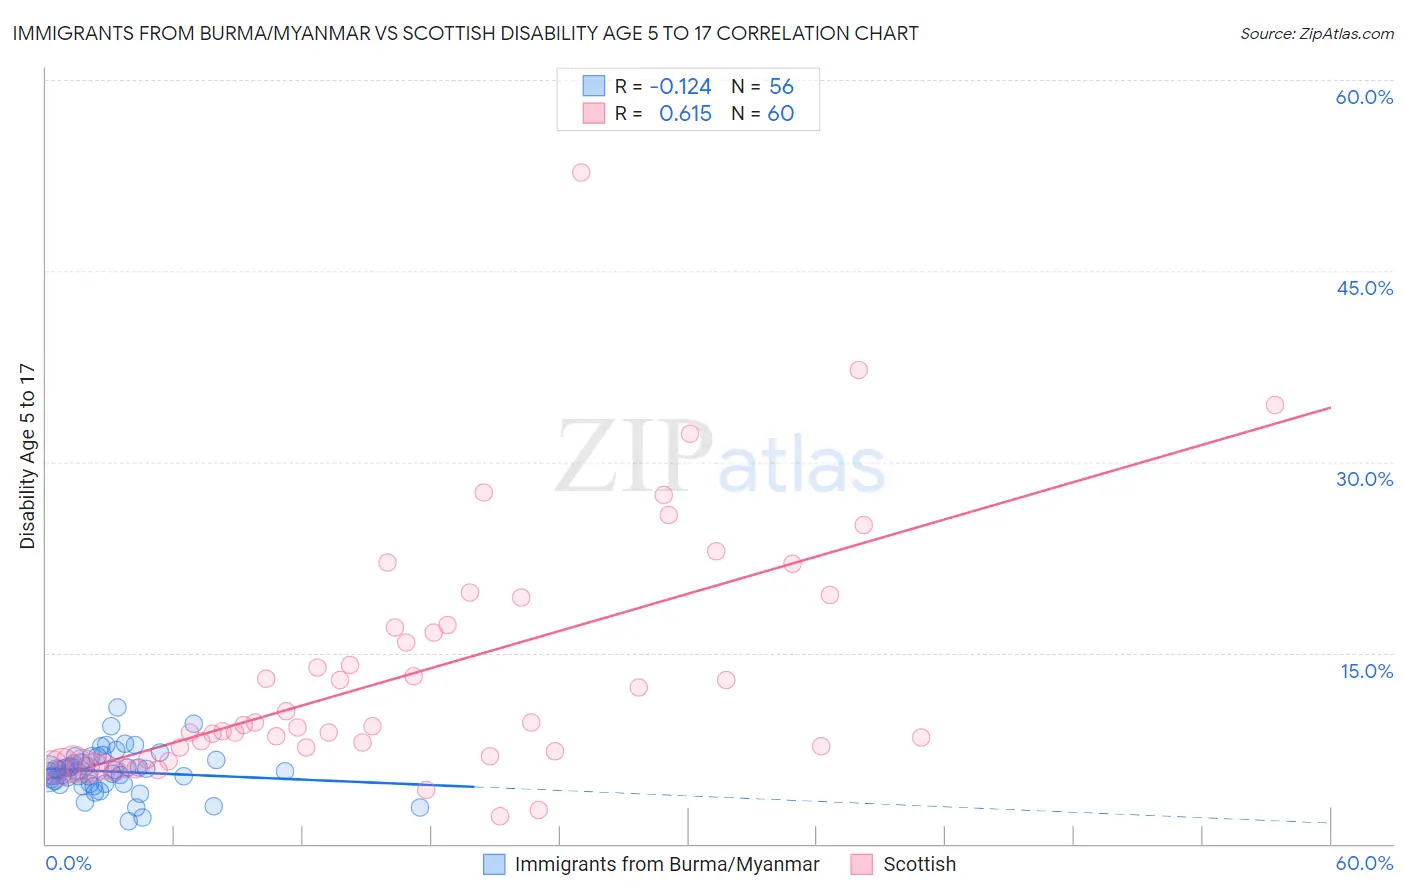
Immigrants from Burma/Myanmar vs Scottish Disability Age 5 to 17 Correlation Chart
The statistical analysis conducted on geographies consisting of 171,966,174 people shows a poor negative correlation between the proportion of Immigrants from Burma/Myanmar and percentage of population with a disability between the ages 5 and 17 in the United States with a correlation coefficient (R) of -0.124 and weighted average of 5.6%. Similarly, the statistical analysis conducted on geographies consisting of 553,365,795 people shows a significant positive correlation between the proportion of Scottish and percentage of population with a disability between the ages 5 and 17 in the United States with a correlation coefficient (R) of 0.615 and weighted average of 6.1%, a difference of 10.0%.
Disability Age 5 to 17 Correlation Summary
| Measurement | Immigrants from Burma/Myanmar | Scottish |
| Minimum | 1.8% | 2.1% |
| Maximum | 10.7% | 52.7% |
| Range | 8.9% | 50.6% |
| Mean | 5.7% | 13.3% |
| Median | 5.7% | 9.1% |
| Interquartile 25% (IQ1) | 4.7% | 6.8% |
| Interquartile 75% (IQ3) | 6.5% | 17.1% |
| Interquartile Range (IQR) | 1.8% | 10.3% |
| Standard Deviation (Sample) | 1.7% | 9.6% |
| Standard Deviation (Population) | 1.7% | 9.5% |
Similar Demographics by Disability Age 5 to 17
Demographics Similar to Immigrants from Burma/Myanmar by Disability Age 5 to 17
In terms of disability age 5 to 17, the demographic groups most similar to Immigrants from Burma/Myanmar are Greek (5.6%, a difference of 0.070%), Lebanese (5.6%, a difference of 0.11%), Immigrants from Scotland (5.6%, a difference of 0.13%), Iraqi (5.6%, a difference of 0.17%), and Immigrants from Norway (5.6%, a difference of 0.18%).
| Demographics | Rating | Rank | Disability Age 5 to 17 |
| South Africans | 73.3 /100 | #160 | Good 5.5% |
| Immigrants | Saudi Arabia | 69.1 /100 | #161 | Good 5.5% |
| Zimbabweans | 67.2 /100 | #162 | Good 5.5% |
| Immigrants | Southern Europe | 64.0 /100 | #163 | Good 5.6% |
| Immigrants | Scotland | 61.9 /100 | #164 | Good 5.6% |
| Lebanese | 61.4 /100 | #165 | Good 5.6% |
| Greeks | 60.6 /100 | #166 | Good 5.6% |
| Immigrants | Burma/Myanmar | 59.3 /100 | #167 | Average 5.6% |
| Iraqis | 56.0 /100 | #168 | Average 5.6% |
| Immigrants | Norway | 55.7 /100 | #169 | Average 5.6% |
| Serbians | 54.0 /100 | #170 | Average 5.6% |
| Immigrants | Iraq | 53.9 /100 | #171 | Average 5.6% |
| Ukrainians | 51.5 /100 | #172 | Average 5.6% |
| Uruguayans | 51.0 /100 | #173 | Average 5.6% |
| Costa Ricans | 50.0 /100 | #174 | Average 5.6% |
Demographics Similar to Scottish by Disability Age 5 to 17
In terms of disability age 5 to 17, the demographic groups most similar to Scottish are Portuguese (6.1%, a difference of 0.25%), German (6.1%, a difference of 0.25%), Immigrants from Jamaica (6.1%, a difference of 0.39%), Ugandan (6.2%, a difference of 0.41%), and Subsaharan African (6.2%, a difference of 0.44%).
| Demographics | Rating | Rank | Disability Age 5 to 17 |
| Cheyenne | 0.2 /100 | #274 | Tragic 6.0% |
| Dutch | 0.2 /100 | #275 | Tragic 6.0% |
| Japanese | 0.1 /100 | #276 | Tragic 6.1% |
| Puget Sound Salish | 0.1 /100 | #277 | Tragic 6.1% |
| Immigrants | Liberia | 0.1 /100 | #278 | Tragic 6.1% |
| Immigrants | Jamaica | 0.1 /100 | #279 | Tragic 6.1% |
| Portuguese | 0.1 /100 | #280 | Tragic 6.1% |
| Scottish | 0.0 /100 | #281 | Tragic 6.1% |
| Germans | 0.0 /100 | #282 | Tragic 6.1% |
| Ugandans | 0.0 /100 | #283 | Tragic 6.2% |
| Sub-Saharan Africans | 0.0 /100 | #284 | Tragic 6.2% |
| English | 0.0 /100 | #285 | Tragic 6.2% |
| Colville | 0.0 /100 | #286 | Tragic 6.2% |
| Pima | 0.0 /100 | #287 | Tragic 6.2% |
| Jamaicans | 0.0 /100 | #288 | Tragic 6.2% |