Apache vs Immigrants from Liberia Disability Age 5 to 17
COMPARE
Apache
Immigrants from Liberia
Disability Age 5 to 17
Disability Age 5 to 17 Comparison
Apache
Immigrants from Liberia
6.4%
DISABILITY AGE 5 TO 17
0.0/ 100
METRIC RATING
313th/ 347
METRIC RANK
6.1%
DISABILITY AGE 5 TO 17
0.1/ 100
METRIC RATING
278th/ 347
METRIC RANK
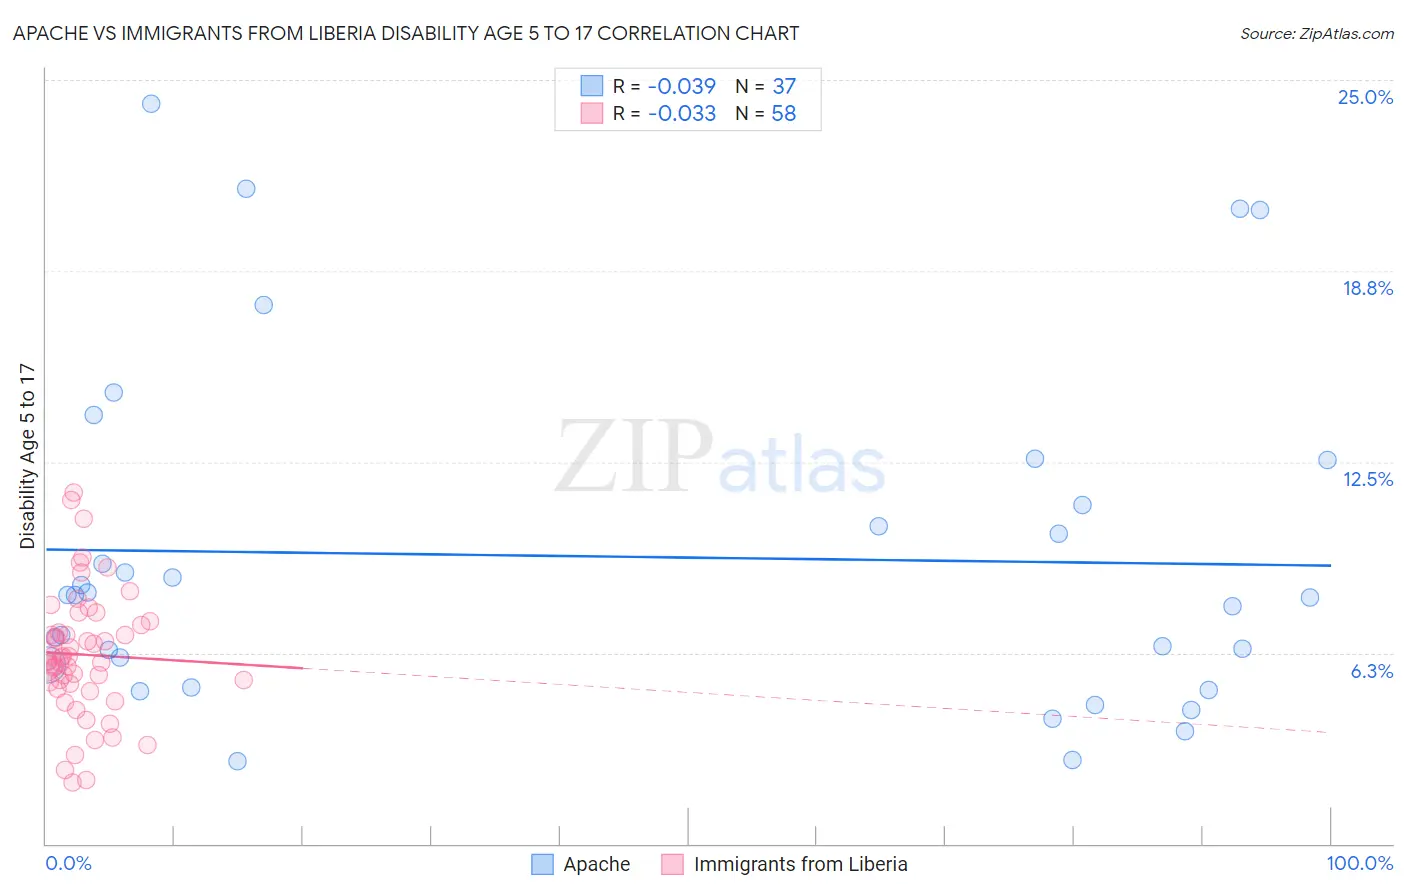
Apache vs Immigrants from Liberia Disability Age 5 to 17 Correlation Chart
The statistical analysis conducted on geographies consisting of 229,980,606 people shows no correlation between the proportion of Apache and percentage of population with a disability between the ages 5 and 17 in the United States with a correlation coefficient (R) of -0.039 and weighted average of 6.4%. Similarly, the statistical analysis conducted on geographies consisting of 135,071,303 people shows no correlation between the proportion of Immigrants from Liberia and percentage of population with a disability between the ages 5 and 17 in the United States with a correlation coefficient (R) of -0.033 and weighted average of 6.1%, a difference of 4.6%.
Disability Age 5 to 17 Correlation Summary
| Measurement | Apache | Immigrants from Liberia |
| Minimum | 2.7% | 2.0% |
| Maximum | 24.2% | 11.5% |
| Range | 21.6% | 9.5% |
| Mean | 9.4% | 6.2% |
| Median | 8.2% | 6.0% |
| Interquartile 25% (IQ1) | 5.5% | 5.3% |
| Interquartile 75% (IQ3) | 11.8% | 7.1% |
| Interquartile Range (IQR) | 6.3% | 1.9% |
| Standard Deviation (Sample) | 5.5% | 2.0% |
| Standard Deviation (Population) | 5.4% | 2.0% |
Similar Demographics by Disability Age 5 to 17
Demographics Similar to Apache by Disability Age 5 to 17
In terms of disability age 5 to 17, the demographic groups most similar to Apache are Bermudan (6.4%, a difference of 0.38%), Immigrants from Dominica (6.3%, a difference of 0.49%), French (6.4%, a difference of 0.51%), Alaskan Athabascan (6.3%, a difference of 0.54%), and Hmong (6.3%, a difference of 0.67%).
| Demographics | Rating | Rank | Disability Age 5 to 17 |
| Immigrants | Nonimmigrants | 0.0 /100 | #306 | Tragic 6.3% |
| Bahamians | 0.0 /100 | #307 | Tragic 6.3% |
| Scotch-Irish | 0.0 /100 | #308 | Tragic 6.3% |
| Hmong | 0.0 /100 | #309 | Tragic 6.3% |
| Alaskan Athabascans | 0.0 /100 | #310 | Tragic 6.3% |
| Immigrants | Dominica | 0.0 /100 | #311 | Tragic 6.3% |
| Bermudans | 0.0 /100 | #312 | Tragic 6.4% |
| Apache | 0.0 /100 | #313 | Tragic 6.4% |
| French | 0.0 /100 | #314 | Tragic 6.4% |
| Immigrants | Portugal | 0.0 /100 | #315 | Tragic 6.4% |
| Immigrants | Dominican Republic | 0.0 /100 | #316 | Tragic 6.4% |
| Kiowa | 0.0 /100 | #317 | Tragic 6.4% |
| Comanche | 0.0 /100 | #318 | Tragic 6.4% |
| Delaware | 0.0 /100 | #319 | Tragic 6.5% |
| Africans | 0.0 /100 | #320 | Tragic 6.5% |
Demographics Similar to Immigrants from Liberia by Disability Age 5 to 17
In terms of disability age 5 to 17, the demographic groups most similar to Immigrants from Liberia are Puget Sound Salish (6.1%, a difference of 0.080%), Immigrants from Jamaica (6.1%, a difference of 0.14%), Portuguese (6.1%, a difference of 0.28%), Scottish (6.1%, a difference of 0.53%), and German (6.1%, a difference of 0.78%).
| Demographics | Rating | Rank | Disability Age 5 to 17 |
| Immigrants | Zaire | 0.2 /100 | #271 | Tragic 6.0% |
| Finns | 0.2 /100 | #272 | Tragic 6.0% |
| Alaska Natives | 0.2 /100 | #273 | Tragic 6.0% |
| Cheyenne | 0.2 /100 | #274 | Tragic 6.0% |
| Dutch | 0.2 /100 | #275 | Tragic 6.0% |
| Japanese | 0.1 /100 | #276 | Tragic 6.1% |
| Puget Sound Salish | 0.1 /100 | #277 | Tragic 6.1% |
| Immigrants | Liberia | 0.1 /100 | #278 | Tragic 6.1% |
| Immigrants | Jamaica | 0.1 /100 | #279 | Tragic 6.1% |
| Portuguese | 0.1 /100 | #280 | Tragic 6.1% |
| Scottish | 0.0 /100 | #281 | Tragic 6.1% |
| Germans | 0.0 /100 | #282 | Tragic 6.1% |
| Ugandans | 0.0 /100 | #283 | Tragic 6.2% |
| Sub-Saharan Africans | 0.0 /100 | #284 | Tragic 6.2% |
| English | 0.0 /100 | #285 | Tragic 6.2% |