Apache vs Immigrants from Belarus Disability Age 5 to 17
COMPARE
Apache
Immigrants from Belarus
Disability Age 5 to 17
Disability Age 5 to 17 Comparison
Apache
Immigrants from Belarus
6.4%
DISABILITY AGE 5 TO 17
0.0/ 100
METRIC RATING
313th/ 347
METRIC RANK
5.0%
DISABILITY AGE 5 TO 17
100.0/ 100
METRIC RATING
37th/ 347
METRIC RANK
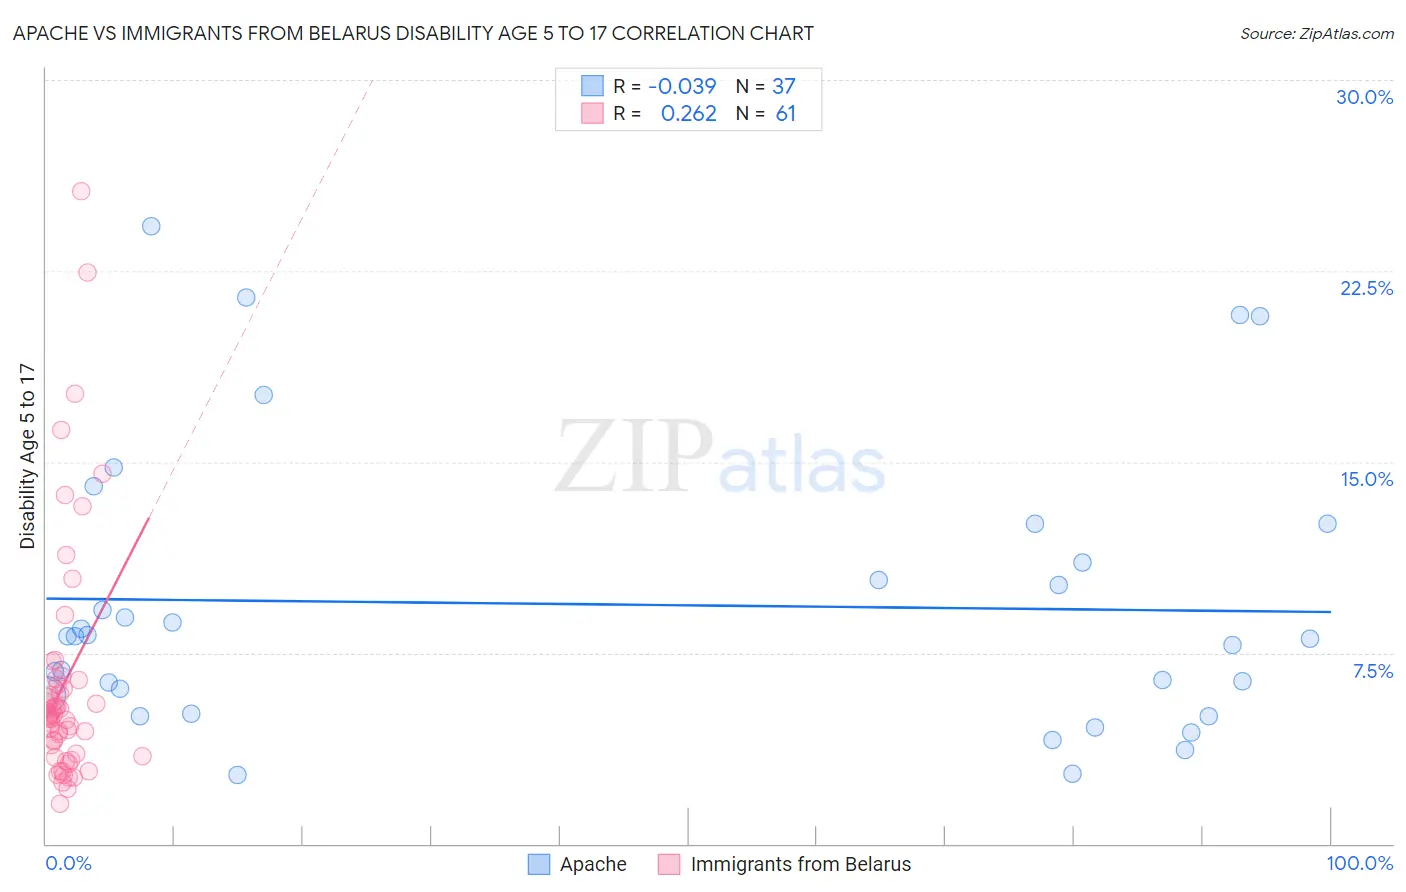
Apache vs Immigrants from Belarus Disability Age 5 to 17 Correlation Chart
The statistical analysis conducted on geographies consisting of 229,980,606 people shows no correlation between the proportion of Apache and percentage of population with a disability between the ages 5 and 17 in the United States with a correlation coefficient (R) of -0.039 and weighted average of 6.4%. Similarly, the statistical analysis conducted on geographies consisting of 149,676,434 people shows a weak positive correlation between the proportion of Immigrants from Belarus and percentage of population with a disability between the ages 5 and 17 in the United States with a correlation coefficient (R) of 0.262 and weighted average of 5.0%, a difference of 27.4%.
Disability Age 5 to 17 Correlation Summary
| Measurement | Apache | Immigrants from Belarus |
| Minimum | 2.7% | 1.6% |
| Maximum | 24.2% | 25.7% |
| Range | 21.6% | 24.1% |
| Mean | 9.4% | 6.3% |
| Median | 8.2% | 5.0% |
| Interquartile 25% (IQ1) | 5.5% | 3.5% |
| Interquartile 75% (IQ3) | 11.8% | 6.3% |
| Interquartile Range (IQR) | 6.3% | 2.9% |
| Standard Deviation (Sample) | 5.5% | 4.7% |
| Standard Deviation (Population) | 5.4% | 4.7% |
Similar Demographics by Disability Age 5 to 17
Demographics Similar to Apache by Disability Age 5 to 17
In terms of disability age 5 to 17, the demographic groups most similar to Apache are Bermudan (6.4%, a difference of 0.38%), Immigrants from Dominica (6.3%, a difference of 0.49%), French (6.4%, a difference of 0.51%), Alaskan Athabascan (6.3%, a difference of 0.54%), and Hmong (6.3%, a difference of 0.67%).
| Demographics | Rating | Rank | Disability Age 5 to 17 |
| Immigrants | Nonimmigrants | 0.0 /100 | #306 | Tragic 6.3% |
| Bahamians | 0.0 /100 | #307 | Tragic 6.3% |
| Scotch-Irish | 0.0 /100 | #308 | Tragic 6.3% |
| Hmong | 0.0 /100 | #309 | Tragic 6.3% |
| Alaskan Athabascans | 0.0 /100 | #310 | Tragic 6.3% |
| Immigrants | Dominica | 0.0 /100 | #311 | Tragic 6.3% |
| Bermudans | 0.0 /100 | #312 | Tragic 6.4% |
| Apache | 0.0 /100 | #313 | Tragic 6.4% |
| French | 0.0 /100 | #314 | Tragic 6.4% |
| Immigrants | Portugal | 0.0 /100 | #315 | Tragic 6.4% |
| Immigrants | Dominican Republic | 0.0 /100 | #316 | Tragic 6.4% |
| Kiowa | 0.0 /100 | #317 | Tragic 6.4% |
| Comanche | 0.0 /100 | #318 | Tragic 6.4% |
| Delaware | 0.0 /100 | #319 | Tragic 6.5% |
| Africans | 0.0 /100 | #320 | Tragic 6.5% |
Demographics Similar to Immigrants from Belarus by Disability Age 5 to 17
In terms of disability age 5 to 17, the demographic groups most similar to Immigrants from Belarus are Immigrants from Egypt (5.0%, a difference of 0.030%), Immigrants from Philippines (5.0%, a difference of 0.040%), Immigrants from Argentina (5.0%, a difference of 0.050%), Bolivian (5.0%, a difference of 0.070%), and Okinawan (5.0%, a difference of 0.13%).
| Demographics | Rating | Rank | Disability Age 5 to 17 |
| Immigrants | Malaysia | 100.0 /100 | #30 | Exceptional 5.0% |
| Immigrants | Pakistan | 100.0 /100 | #31 | Exceptional 5.0% |
| Soviet Union | 100.0 /100 | #32 | Exceptional 5.0% |
| Immigrants | Indonesia | 100.0 /100 | #33 | Exceptional 5.0% |
| Israelis | 100.0 /100 | #34 | Exceptional 5.0% |
| Bolivians | 100.0 /100 | #35 | Exceptional 5.0% |
| Immigrants | Egypt | 100.0 /100 | #36 | Exceptional 5.0% |
| Immigrants | Belarus | 100.0 /100 | #37 | Exceptional 5.0% |
| Immigrants | Philippines | 100.0 /100 | #38 | Exceptional 5.0% |
| Immigrants | Argentina | 100.0 /100 | #39 | Exceptional 5.0% |
| Okinawans | 100.0 /100 | #40 | Exceptional 5.0% |
| Immigrants | Australia | 100.0 /100 | #41 | Exceptional 5.0% |
| Immigrants | Sri Lanka | 100.0 /100 | #42 | Exceptional 5.0% |
| Immigrants | Russia | 100.0 /100 | #43 | Exceptional 5.0% |
| Egyptians | 100.0 /100 | #44 | Exceptional 5.0% |